
Figure 5.
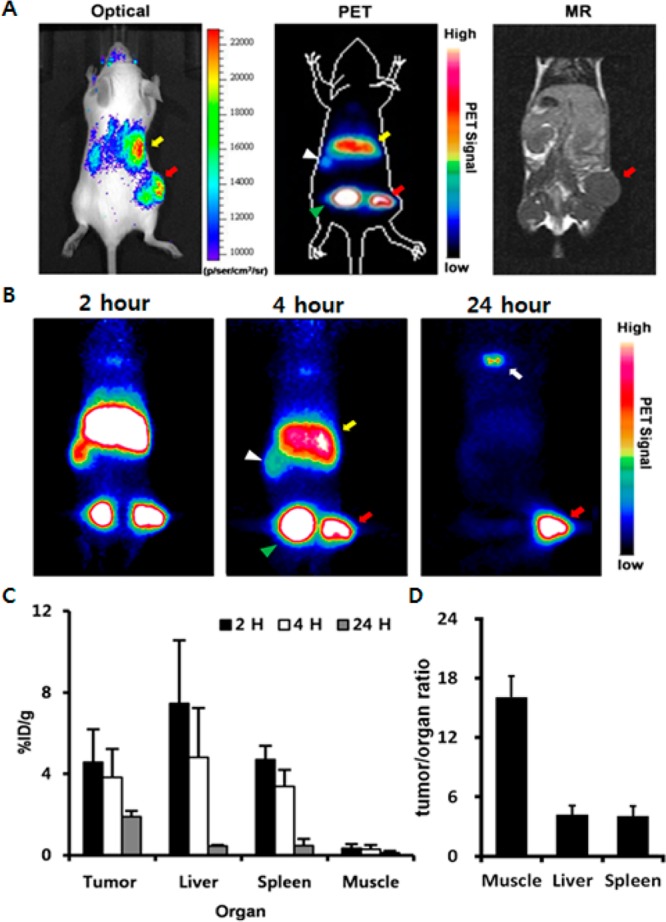
Typical optical luminescence, PET and MR image of CT26 tumor-bearing mouse at 4 h postinjection of [124I]HIB-Gd-liposome (n = 3) (a). Tumor, red arrow; liver, yellow arrow; spleen, white arrowhead; bladder, green arrowhead. Maximum intensity projection images of PET at 2, 4, and 24 h (b). Thyroid: white arrow. Radioactivity uptakes in various organs at 2, 4, and 24 h (n = 3) (c). Tumor-to-organ uptake ratio at 24 h (d).