. 2014 May 15;31(2):Doc21. doi: 10.3205/zma000913

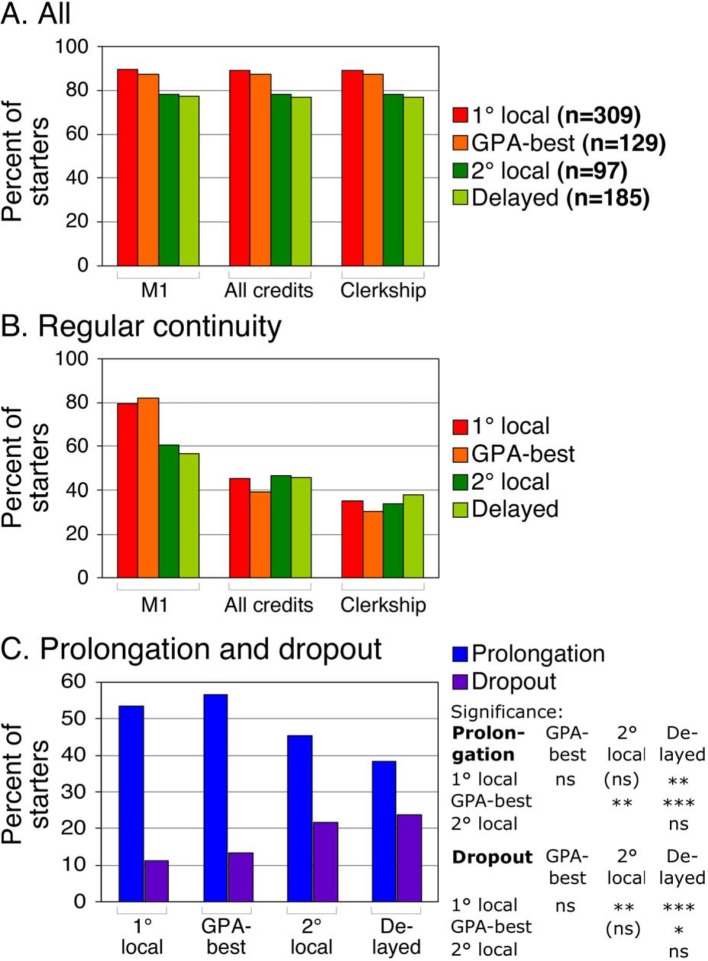
Figure 4. Studies continuity of the different admission groups. Continuity was assessed at the following end-points: passing the first part of the Medical Licensing Examination (M1), the completion of all prescribed courses (all credits) and the beginning of the clerkship year. A. Percentage of the enrolled students (starters) of the different admission groups who reached the given end-points during the investigation. B. Percentage of the starters who reached the given end-points in the prescribed (regular) time. C. Percentage of the starters, who prolonged their studies or dropped out prematurely. The significance of the differences was tested by χ2-test for binomial proportions. Abbreviations: (All) all students over the complete course; (1°, 2°) primary and secondary local admission groups; (***) p≤0.001; (**) p≤0.01; (*) p≤0.05; ((ns)) 0.05<p≤0.10; (ns) not significant.

Figure 4