
Figure 6.

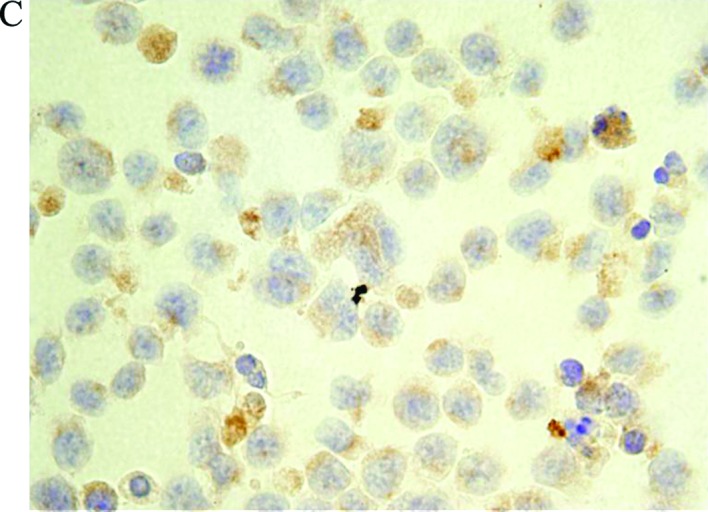
Galectin-1 and ST6Gal1 expression. (A) H-ALCL cells show galectin-1 expression in the cytoplasm on immunohistochemical analysis (magnification, ×200). (B) Galectin-1 was produced in autocrine fashion in H-ALCL cell line (*P=0.030705; **P=0.023544). CONC, concentration. The data are a representative of two independent experiments in triplicate. (C) ST6Gal1 is expressed in the cytoplasm of H-ALCL cells (magnification, ×200).