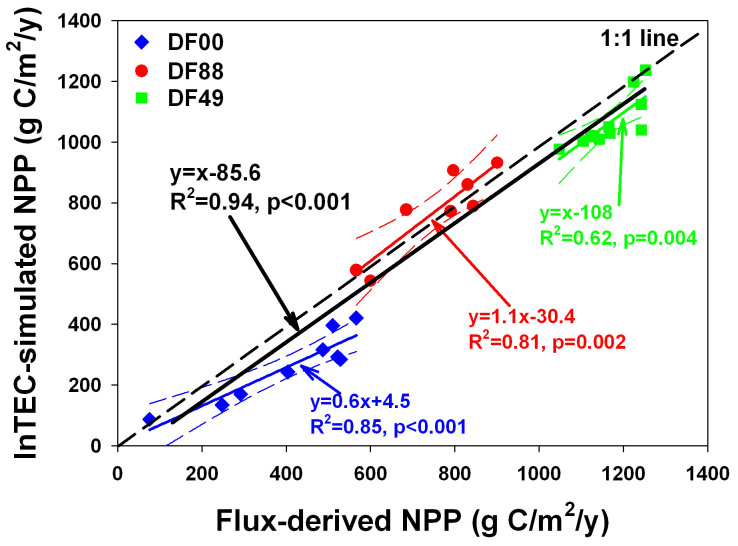
Figure 1. Relationships between flux-tower derived estimates of annual net primary productivity (NPP) and InTEC-simulated NPP for three chronosequences Douglas-fir stands in B.C.
DF00 ( ), DF88 (
 ) and DF49 (
 ) represent flux sites of Douglas-fir stands harvested in 2000, 1988, and 1949, respectively. Solid and dash lines are the regression and 95% confidence levels for mean prediction, respectively.

