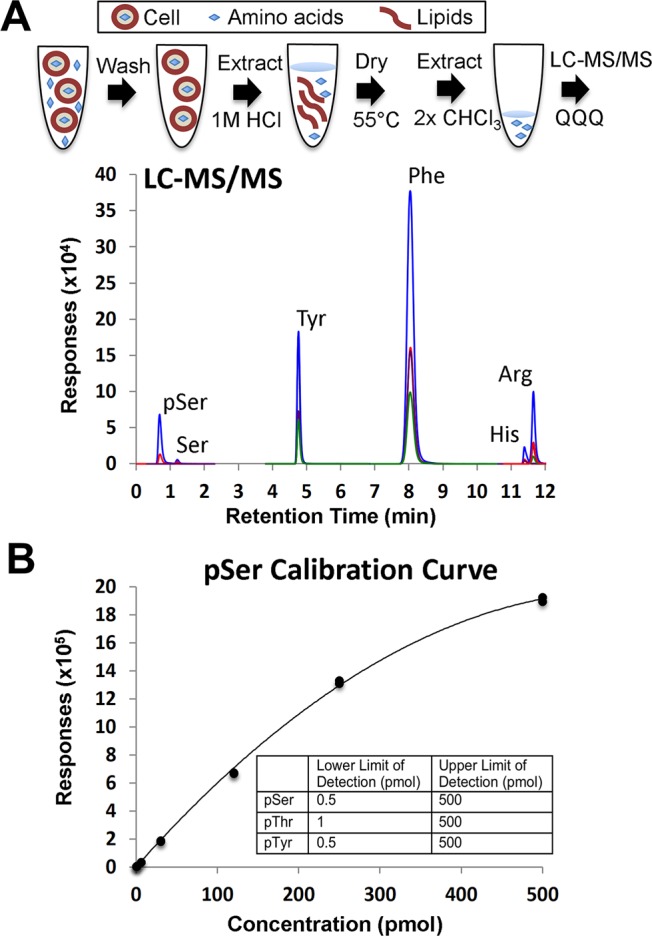
Figure 1.

LC–MS/MS analysis of phosphorylated amino acids. (A) Scheme showing the preparation of cell extracts for LC–MS/MS analysis. A typical chromatogram from an LC–MS/MS run of a 90 pmol amino acid standard is shown. Unique MRM transitions are plotted for the amino acids indicated above the individual peaks. (B) Representative calibration curve for pSer. Calibration curves for all analytes were acquired daily in duplicate, and calibration curves were obtained after applying a weighted (1/x) quadratic curve fit. The fitted calibration function for this curve was y = −5.095375x2 + 6398.390847x – 673.466721, and the maximum % residual was 3.9. Experimentally determined lower and upper limits of quantitation for pSer, pThr, and pTyr are listed in the table.
