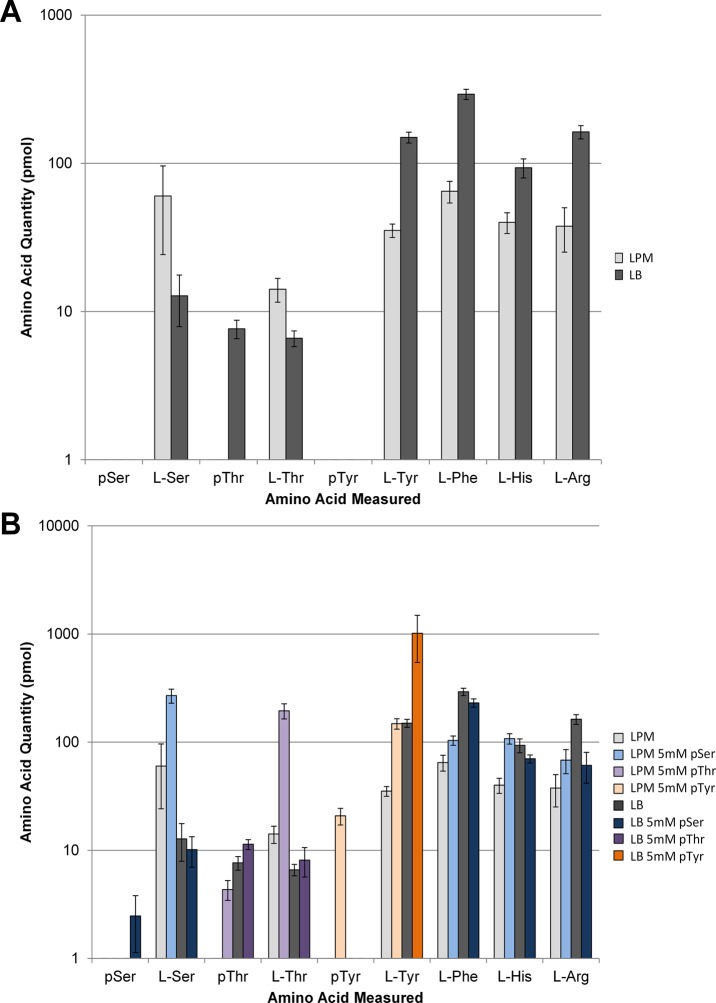
Figure 2.
Quantitation of intracellular amino acids in E. coli extracts. (A) Measured amino acid quantities of select amino acids in K12 BW25113 WT E. coli grown in LPM (light gray) and LB (dark gray) media. (B) Relative amino acid concentrations of K12 BW25113 WT E. coli grown in LPM (light gray) and LB (dark gray) media compared to WT E. coli grown in LPM with 5 mM pSer (light blue), LB with 5 mM pSer (dark blue), LPM with 5 mM pThr (light violet), LB with 5 mM pThr (dark violet), LPM with 5 mM pTyr (light orange), and LB with 5 mM pTyr (dark orange). Error bars were calculated using the 95% confidence interval with n = 5.

