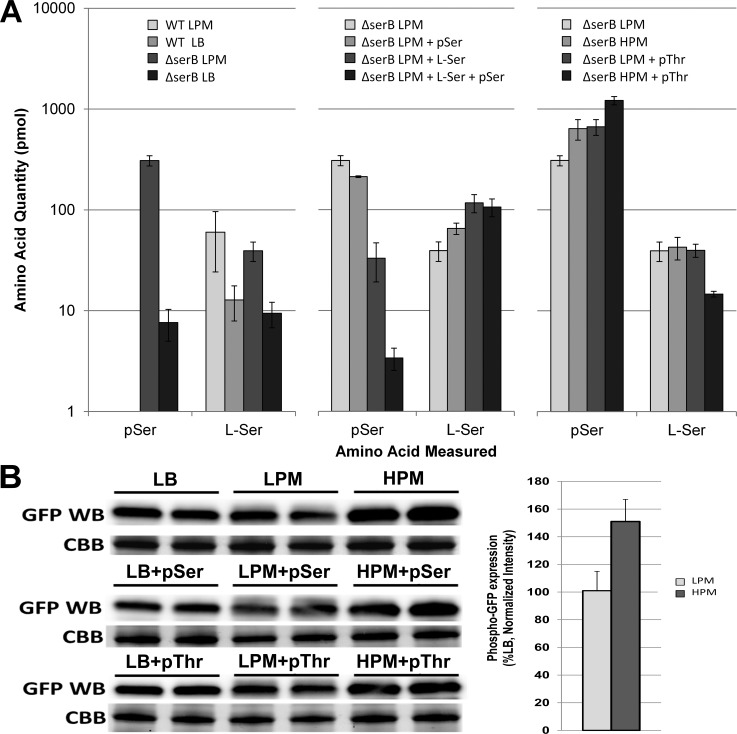
Figure 4.
Dynamic levels of pSer in the cell and in protein synthesis. (A) pSer and Ser levels in K12 BW25113 WT extracts and the corresponding ΔserB strain grown in LPM, LB and HPM media supplemented with pSer and pThr and l-Ser. (B) Western blot analysis of E17TAG-GFP (GFP) expressed in EcAR7(ΔserB) with the indicated media conditions. Coomassie brilliant blue (CBB) gels are shown as a loading control and for normalizing expression ratios. Expression ratios were calculated for E17TAG-GFP expression in LPM and HPM without supplementation of phosphoamino acids and plotted as a percentage of LB expression. Error bars were calculated using the 95% confidence interval with n = 3.

