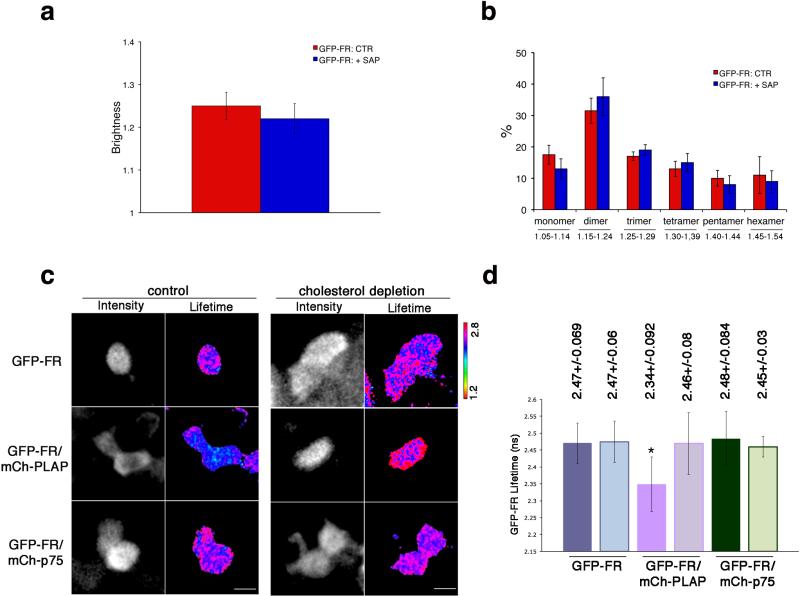
Figure 2. Apical GPI-AP homo- and hetero-clusters have different sensitivity to cholesterol depletion.
After 4 days in culture, polarized MDCK expressing GFP-FR were treated with saponin and imaged in vivo for N&B (a,b) or FLIM (c,d). (a) Quantification of the brightness of GFP-FR from 3 independent experiments is plotted. Error bars, ± SD. (b) Graphical representation of the percentage of pixels falling in the different classes of B values (from monomer to hexamer) on the basis of the calibration curve shown in Supplementary Fig. 4g. Values are expressed as mean of 3 independent experiments. Error bars, ± SD. (c) Intensity and mean fluorescence lifetime maps of GFP-FR alone or in presence of either mCherry-PLAP or mCherry-p75 in control or cholesterol depleted cells. The lifetime scale is from 1.2 ns to 2.8 ns. Cells were imaged live by scanning ROIs of 140×140 pixels corresponding to 4-6 cells of the confluent polarized monolayer. Dark areas correspond to cells either not expressing or out of focus (see methods and comparison between N&B and FLIM images in Supplementary Fig. 6a). Bars, 9 μm. (d) Histograms of GFP-FR lifetime (ns) alone (blue bars) or in combination with mCherry-PLAP (pink bars) or mCherry-p75 (green bars) in control conditions (colored bars) or upon cholesterol depletion (pale colored bars). Experiments were performed 3×, n>35 cells. Error bars, ± SD. *, p<0,0001.

