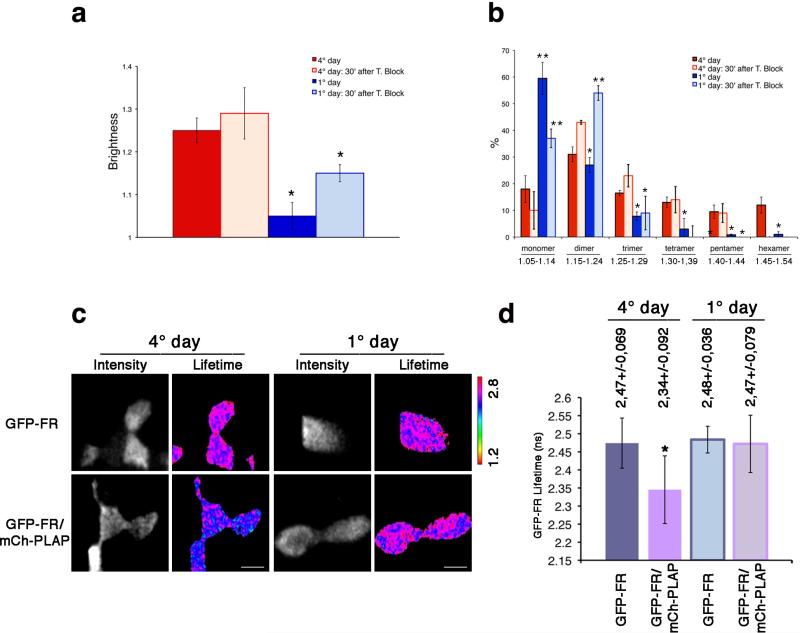
Figure 3. Both homo-cluster and hetero-cluster organization is dependent on the polarity status of MDCK cells.
N&B (a,b) and FLIM (c,d) analysis were performed in MDCK cells after 1 or 4 days in culture. (a) Quantification of the brightness of different populations of GFP-FR molecules at the cell surface for the steady state population (colored bars) and newly arrived population (pale colored bars) from 3 independent experiments is plotted. Error bars, ± SD. *, p<0,000001. (b) Graphical representation of the percentage of pixels falling in the different classes of B values (from monomer to hexamer) on the basis of the calibration curve shown in Supplementary Fig. 4g. Values are expressed as mean of 3 independent experiments. Error bars, ± SD. *, p<0.05; **, p<0.008; ***, p<0.00005. (c) Intensity and mean fluorescence lifetime maps of GFP-FR alone or in combination with mCherry-PLAP. The lifetime scale is from 1.2 ns to 2.8 ns. Bars, 9 μm. (d) Histograms of GFP-FR lifetime alone (blue bars) or in combination with mCherry-PLAP (pink bars) in polarized MDCK cells (4 days of culture, colored bars) or in non-polarized MDCK cells (1 day of culture, pale colored bars). Experiments were performed 2×, n>15 cells. The error bars are the mean ± SD. *, p<0,0001.

