Figure 4.

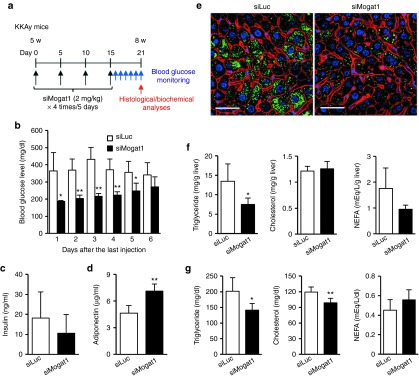
In vivo validation of a candidate Mogat1 gene via long-term silencing. (a) Schedule of siMogat1 treatment in prediabetic KKAy mice. Serum glucose was monitored for 6 days in KKAy mice treated with four injections of siMogat1- or siLuc-loaded nanoparticles. Other histological and biochemical analyses were performed on the sixth day after the last injections (n = 4 and 7 for siMogat1 and siLuc group, respectively). (b) Improved serum glucose levels of siMogat1-treated mice. Normal blood glucose was monitored for 6 consecutive days at the same time points. (c) Serum insulin and (d) adiponectin levels. (e) Representative fluorescent image of decreased ectopic fat deposition in the liver. Lipid droplets, F-actin, and nuclei were stained with boron-dipyrromethene (green), rhodamine-phalloidin (red), and Hoechst 33342 (blue), respectively. Bar = 50 μm. (f) Hepatic and (g) serum lipid contents after the treatment of siMogat1 (n = 4–7). Mean ± SD are shown for all panels. *P < 0.05, **P < 0.01, Student's t-test. siLuc, siRNA against luciferase; siMogat1, siRNA against monoacylglycerol O-acyltransferase 1.
