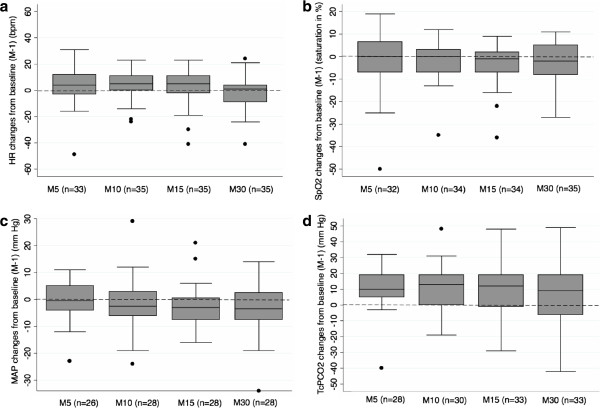
Figure 1.
Absolute changes from baseline (median, IQR, extremes) in heart rate (a), SpO2 (b), mean arterial blood pressure (c) and TcPCO2 (d) at observed time points. X axis (time points): M-1: one minute before atropine injection, M5: 5 minutes after atropine injection, M10: 10 minutes after atropine injection, M15: 15 minutes after atropine injection, M30: 30 minutes after atropine injection. Y axis: Numerical difference from baseline value for each parameter. Boxes represent values between the 1st and the 3rd quartile. The bar inside the box denotes median value. The adjacent values are the most extreme values within 1.5 inter-quartile range of the nearer quartile. Black dots are outliers outside adjacent values. Numbers in parenthesis denote the number of available measures at each time point. HR: heart rate, MAP: mean arterial blood pressure.

