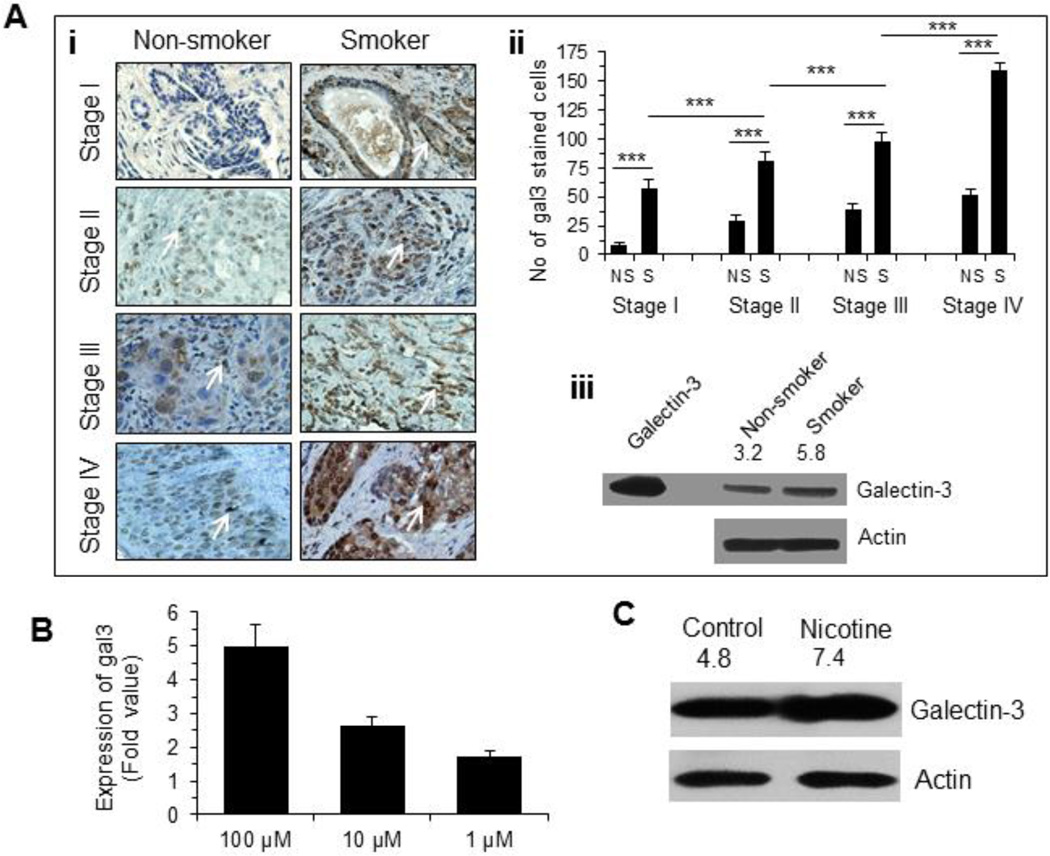
Figure 2. Nicotine induced galectin-3 expression.
A. (i) Representative diagrams showing expression of galectin-3 in various stages of breast cancer tissue specimens from 22 patients (see Table 1 for description) who never smoked and smoked as determined by immunostaining with anti-galectin-3 antibody. Magnification 400×. (ii) A bar graph showing quantitative expression of galectin-3 for each stage of smoker and non-smoker breast cancer patients (n =22). Galectin-3 staining of each sample was performed in duplicate or in triplicate. The number of cells showing positive staining of galectin-3 was scored independently and blindly in 3 different area of each slide and then data were expressed as mean ± S.D, where *** represents p≤0.001. (iii) Expression of galectin-3 in stage III breast cancer tissue specimens (receptor-matched non-smoker & smoker) as determined by western blot. Recombinant galectin-3 was used as a positive control to validate the molecular weight of the galectin-3 band in tissues. The number on top of blot represents arbitrary unit showing quantification of the galectin-3 expression as measured by Image J software. B. Expression of gal3 in nicotine (1–100 µM) treated MCF-7 cells (48 h) as measured by quantitative RT-PCR. Relative mRNA expression was calculated according to the comparative ΔΔC(t) method. C. Validation of gal3 expression in untreated and nicotine-treated (100 µM, 48 h) MCF7 cells by Western blot. The number on top of blot represents arbitrary unit showing quantification of the gal3 expression as measured by Image J software.

