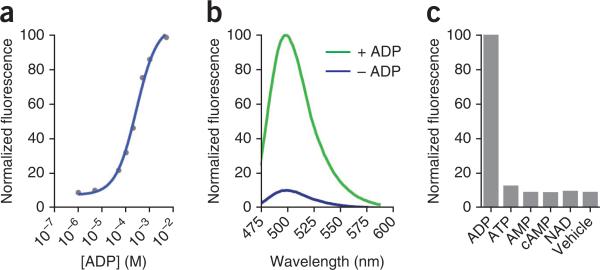
Figure 2.
Characteristics of the ADP sensor. (a) Dose-response curve of fluorescence of the ADP sensor with increasing concentrations of ADP. (b) Emission spectra of the ADP sensor in the presence or absence of ADP. (c) Molecular discrimination of the ADP sensor. Fluorescence brightness values for the ADP sensor in the presence of 1 mM ADP, ATP, AMP, cyclic AMP (cAMP), nicotinamide adenine dinucleotide (NAD) or vehicle are shown.

