Figure 3.
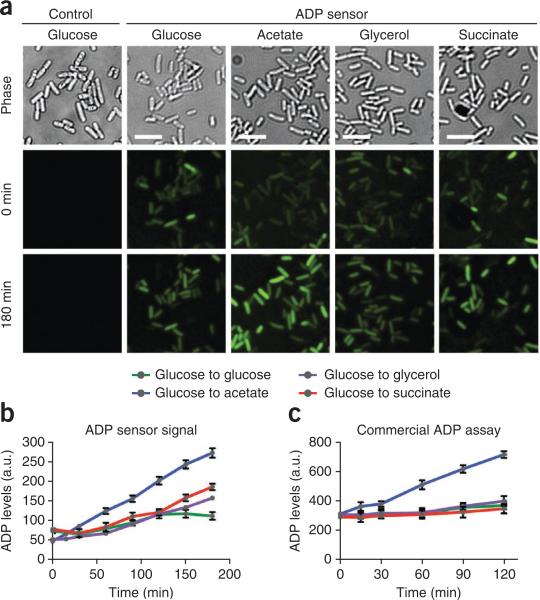
Live-cell imaging and analysis of endogenous ADP levels. (a) E. coli cells expressing the ADP sensor grown in various carbon sources. Cells grown in minimal medium containing 200 μM DFHBI and glucose were switched to alternate carbon sources as indicated. Images shown were obtained at 0 and 180 min after medium change, respectively. Scale bars, 5 μm. (b) Quantification of ADP levels on the basis of ADP sensor fluorescence signal. Individual cells were imaged over 3 h, and fluorescence was measured and normalized to cellular area by using ImageJ software. Results shown represent mean and s.e.m. values for 150 cells per condition. (c) Quantification of ADP levels by using a commercially available ADP assay. Cells grown under identical conditions to those used for the ADP sensor assay were subjected to a bulk fluorometric ADP assay. Shown are mean and s.e.m. values for three independent experiments. The results of this assay correlate well to signal changes observed using the ADP sensor. a.u., arbitrary units.

