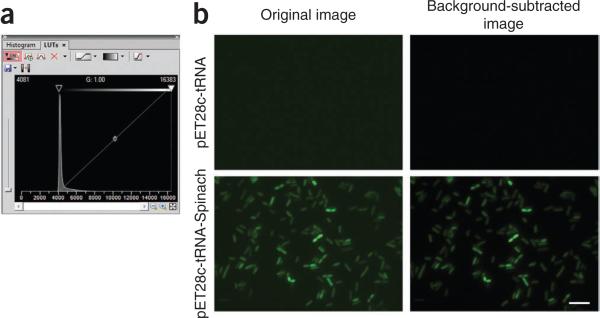
Figure 4.
Background subtraction using the NIS Elements software. (a) Screenshot of the LUT panel of the NIS Elements software. Background subtraction should be carried out by adjusting the lower threshold (yellow arrow) such that the mean intensity within an E. coli is zero. The mean intensity within a cell is typically zero when the lower threshold is set adjacent to the intensity peak as shown. (b) Examples of background-subtracted images. Images are shown before (left column) and after (right column) background subtraction. The upper row shows negative control cells, expressing tRNALys alone. The lower row shows cells expressing Spinach. Scale bar, 5 μ.

