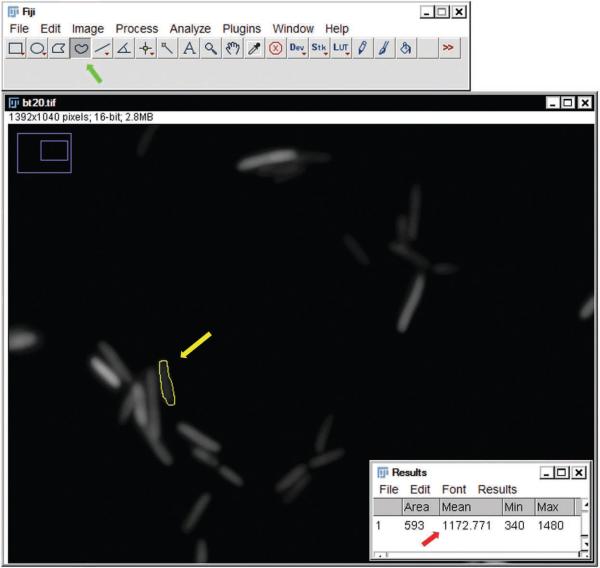
Figure 5.
Quantification of mean fluorescence in E. coli. Screenshot of image analysis with Fiji software. The free drawing tool (green arrow in toolbar) can be selected in order to draw a circle around an E. coli cell of interest (yellow circle, yellow arrow). Once this object is selected, the software will calculate the average intensity within the cell. This value will be displayed in a pop-up window, as indicated by the red arrow.

