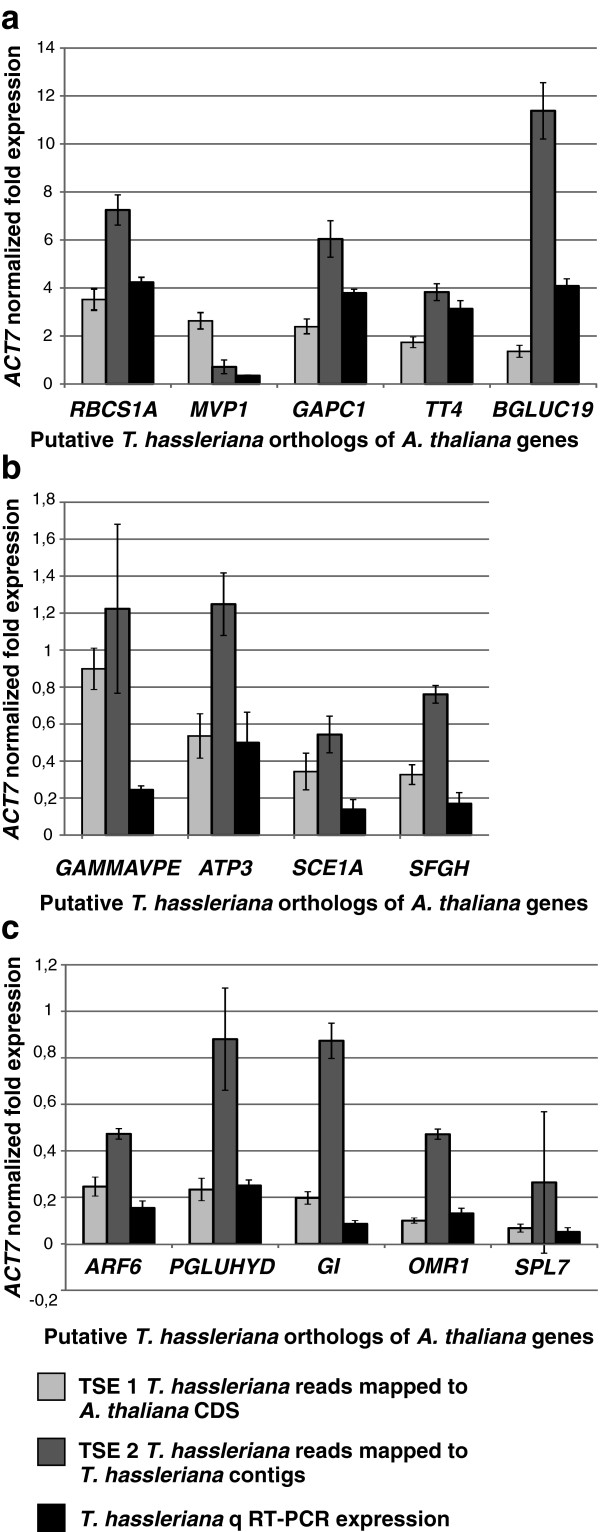
Figure 3.
Comparative analysis of Transcriptome Sequencing based Expression data (TSE) with qRT-PCR expression data. The TSE and the qRT-PCR expression were normalized with the putative T. hassleriana ACTIN7 homolog. The first column represents the TSE 1 where the T. hassleriana reads are mapped on to the A. thaliana CDS sequences; the second column represents the TSE 2 where the T. hassleriana reads are mapped on the T. hassleriana contigs and the third column represents the qRT-PCR expression data. a: Comparison of TSE and qRT-PCR in genes with high expression (750–2000 RPKM, b: Comparison of TSE and qRT-PCR in genes with moderate expression (150–300 RPKM) and c: Comparison of TSE and qRT-PCR in genes with low gene expression (25–150 RPKM). The error bars represent the standard deviation and the P-values for statistical significance between expression values are presented in Additional file 1: Table S4.

