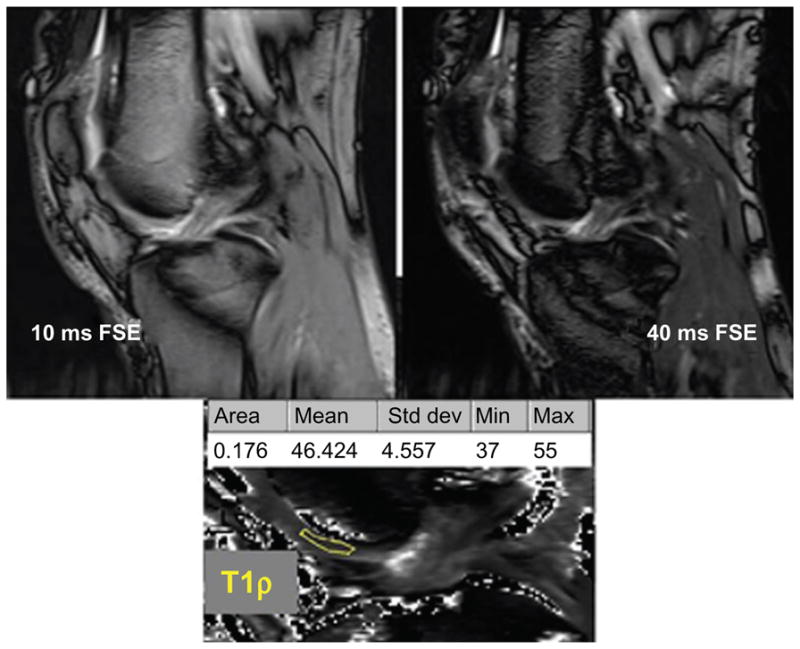
Figure 1.

In vivo 3.0 T sagittal slices through the distal femoral trochlea.
Notes: Fast spin-echo (FSE) images at different spin-lock times are combined to create a map of T1ρ relaxation times. The region of interest (ROI) is outlined in yellow. Cartilage surface and bone interface voxel exclusion avoids partial-volume effects.
