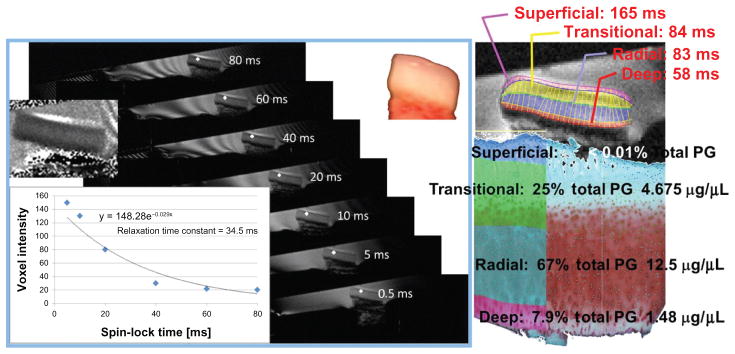
Figure 2.

The voxel’s value at each spin-lock time is identified.
Notes: T1ρ maps were computed on a voxel-by-voxel basis with robust nonlinear least-squares fits (with bisquare weights) of a mono-exponential decay curve to derive relaxation times in this ex vivo 4.7 T magnetic resonance imaging series of biopsy fast spin echo images. Histologically defined cartilage zones are imposed and zonal T1ρ relaxation times extracted for direct comparison with zonal proteoglycan (PG) distributions from automated Mankin scoring of Safranin O red intensity.
