
Figure 6.
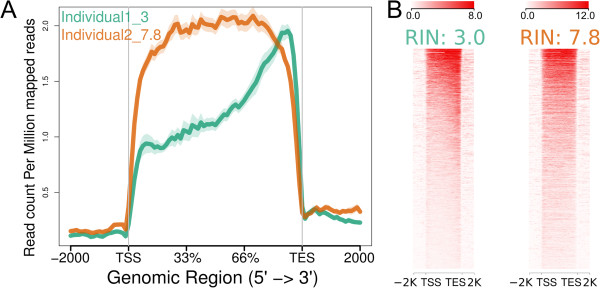
RNA-seq plots of two human postmortem brain samples with different RIN values. A. Average profiles. B. Heatmaps.
Official websites use .gov
A
.gov website belongs to an official
government organization in the United States.
Secure .gov websites use HTTPS
A lock (
) or https:// means you've safely
connected to the .gov website. Share sensitive
information only on official, secure websites.
RNA-seq plots of two human postmortem brain samples with different RIN values. A. Average profiles. B. Heatmaps.