
Figure 3.
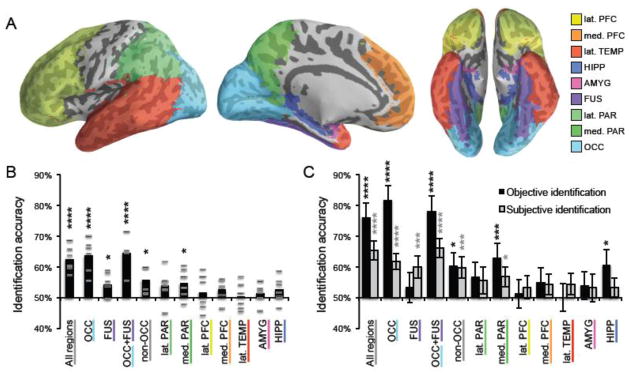
Identification accuracy for reconstructed faces by ROI. (A) Using a standard space brain atlas, nine anatomical ROIs were generated, corresponding to: lateral prefrontal cortex (lat. PFC), medial prefrontal cortex (med. PFC), lateral temporal cortex (lat. TEMP), hippocampus (HIPP), amygdala (AMYG), fusiform gyrus (FUS), lateral parietal cortex (lat. PAR), medial parietal cortex (med. PAR), and occipital cortex (OCC). (B) Mean objective (Euclidean distance-based) identification accuracy for reconstructions generated from each participant (grey, horizontal lines) and the average across participants for each ROI (black, vertical bars). For each ROI, accuracy across participants was compared to chance performance (50%) via a one-sample t-test. (C) Black bars represent objective (Euclidean distance-based) identification accuracy for mean reconstructions (i.e., reconstructions averaged across participants). Error bars reflect the standard deviation in accuracy when the reconstruction labels were randomly permuted 100,000 times. Accuracy was compared to chance by measuring the proportion of times a randomly permuted set achieved greater accuracy than the reconstruction set itself. Grey bars represent subjective (human-based) identification accuracy for mean reconstructions. Error bars reflect standard error of the accuracy for each image (i.e., proportion of times it was chosen over the lure by an Amazon Mechanical Turk participant). Accuracy was compared to chance using a one-sample t-test of the null hypothesis that the accuracy of each image was distributed with mean 0.5. **** p < .001, *** p < .005, * p < .05.