
Figure 6.
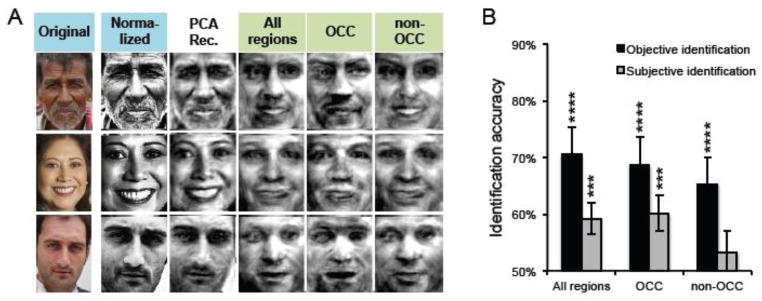
(A) Example test images in their original form (left column), normalized form (second column from left) form, and the ‘non-neural’ PCA reconstructions (third column from left), alongside reconstructions from three regions of interest: all regions, occipital (OCC), and non-occipital (non-OCC). (B) Mean “objective” and “subjective” identification accuracies for reconstructions based on normalized images from the three regions of interest. For an explanation of the error bars and of how accuracy was compared to chance, see Figure 3C. **** p < .001, *** p < .005.