
Figure 7.
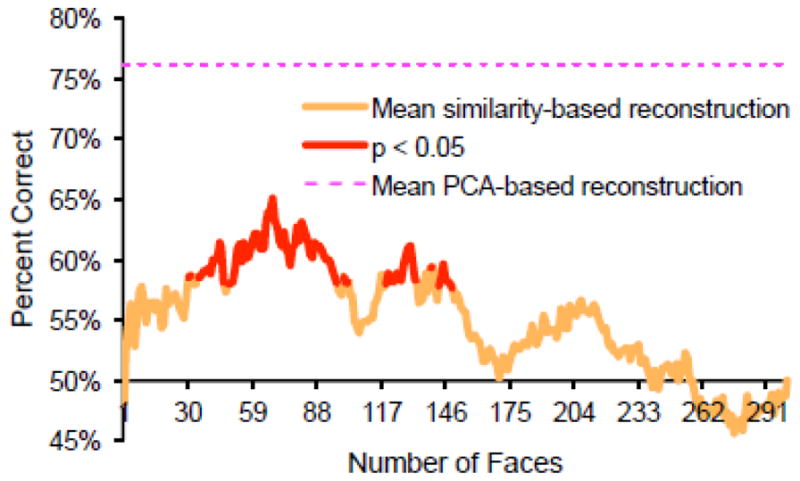
Mean objective identification accuracy of similarity-based reconstructions (averaged across participants). Accuracy is plotted as a function of the number of faces included (averaged across) in the reconstruction. For example, identification accuracy when n = 60 refers to accuracy based on a reconstruction that equals the average of the 60 training faces that elicited the most similar pattern of activity to a given test face. Statistical significance was again established by randomly permuting the labels on the reconstructed images 100,000 times and measuring the proportion of times a randomly permuted set achieved greater accuracy than the reconstruction set itself. Mean accuracy of the PCA-based mean reconstructions (from the all regions ROI) is shown for comparison (dashed, magenta line).