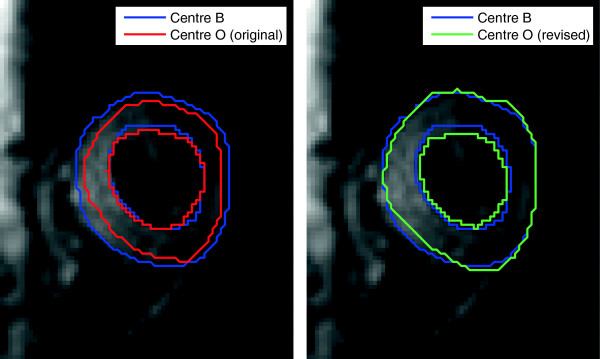
Figure 2.

Differences between regions of interest at the two centres. Caption: Left shows the ROIs from the two centres as originally drawn. On the right the blue curves are the same and the green shows the better matched revised ROI from Centre O, referred to as similar ROIs in the text.
