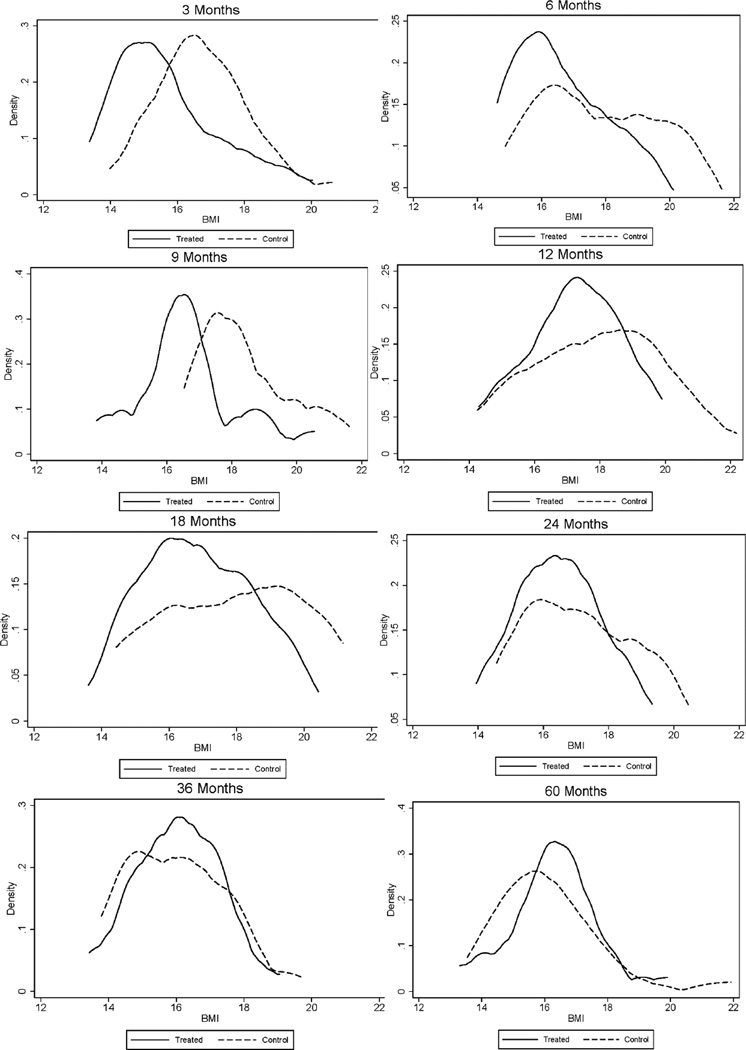
Fig. 3.
Body Mass Index (BMI) ages 0–5 by Treatment Status, Females. The black solid line depicts the density for treated males; the black dashed line depicts the density for control males. The graphs display non-parametric kernel estimates of the probability density function based on the Epanechnikov kernel. The kernel K is K (u) = ¾ (1-u2)1[|u|≤1], where 1[·] is an indicator function.

