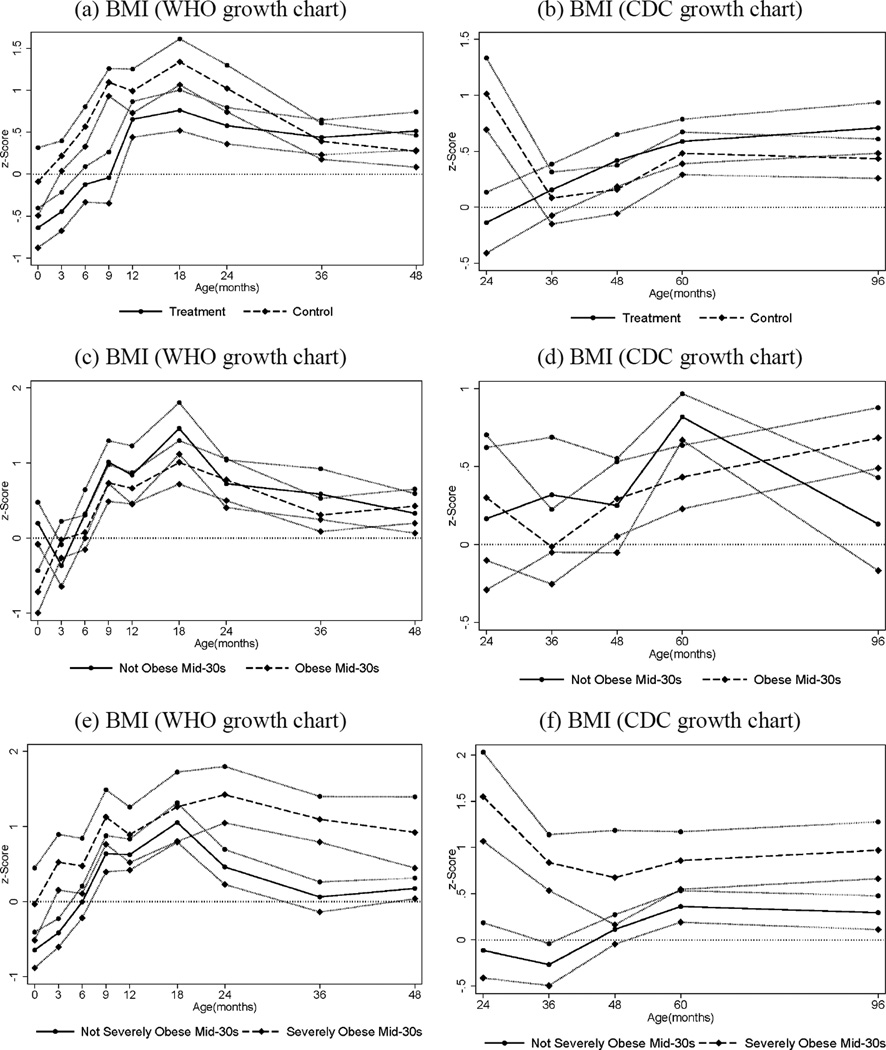
Fig. 4.
Body Mass Index ages 0–4 (figures a, c, e) and 2–8 (figures b, d, f), by Treatment and Obesity Status at Mid-30s, Females. The graphs show BMI z -scores at different points in childhood (0, 3, 6, 9, 12, 18, 24, 36, 48, 60, and 96 months) by treatment and control status (panels a–b), by obesity status (BMI≥30) in adulthood (panels c–d), and by severe obesity status (BMI ≥35) in adulthood (panels e –f). Solid and dashed lines represent mean BMI by age for different groups while the bands around each line represent standard errors for the corresponding means (one standard error above and below). Figures (a), (c) and (e) use the WHO (World Health Organization) growth charts to construct the z -scores; figures (b), (d) and (f) use the CDC (Center for Disease Control) growth charts. The CDC recommends the use of the WHO growth charts for less than 2 years of age (see www.cdc.gov/growthcharts/who_charts.htm).

