
Figure 1. Mismatch Negativity (MMN) for each Group and Deviant Type.
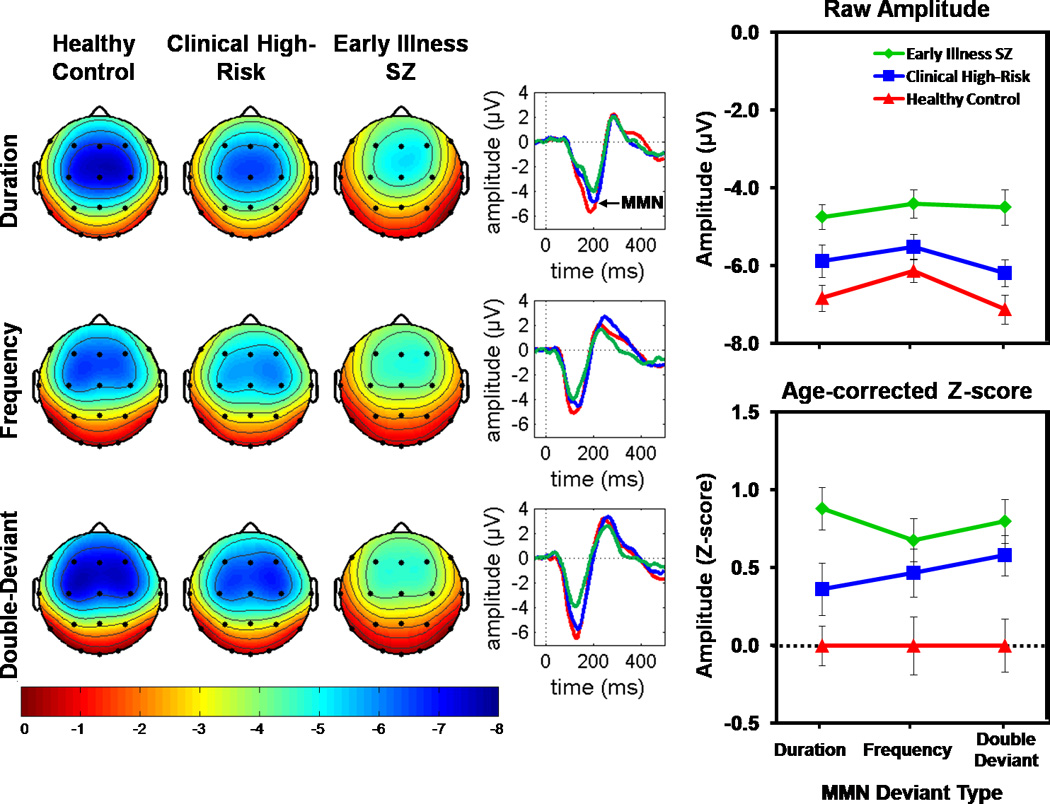
On the left, scalp voltage topography maps of MMN amplitudes are shown for each group and deviant type. MMN topography maps show the group means of MMN amplitudes associated with subject-specific median peak latency across the six fronto-central leads (F3, Fz, F4, C3, Cz, C4). All maps are plotted on the same voltage scale (µV) as indicated in the legend. In the center, ear-referenced ERP difference waveforms averaged across the six fronto-central leads for Duration, Frequency, and Double-Deviant MMN are shown for each group. On the right, line graphs show group means and standard errors for raw MMN amplitude in microvolts (top) and MMN age-corrected z-scores (bottom). Healthy Controls are shown in red, Clinical High Risk patients in blue, and Early Illness Schizophrenia (SZ) patients in green. MMN is reduced in Early Illness SZ and Clinical High Risk patients relative to Healthy Controls across deviant type.