
Fig. 2.
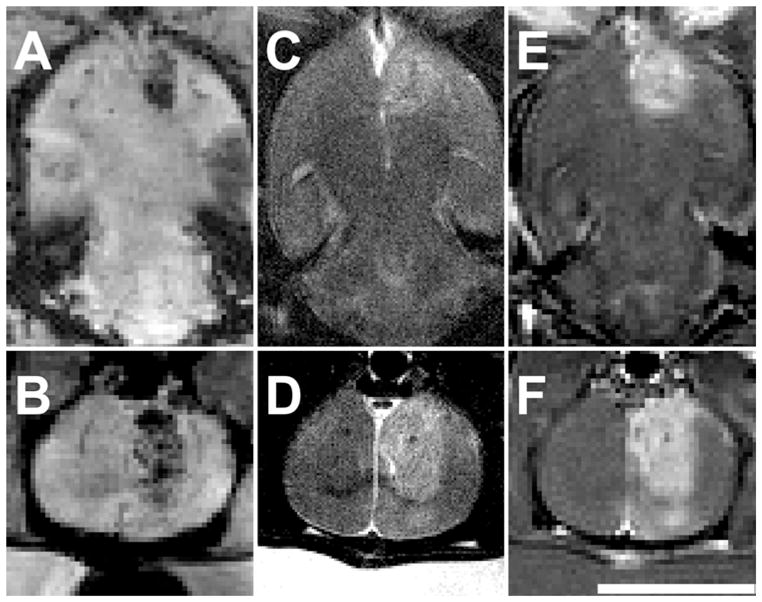
Magnetic resonance images of lesions immediately after sonication at 174 kPa combined with 20 μl/kg USCA. The lesions were somewhat heterogeneous in appearance, but in general were hypointense on T2*-weighted imaging (A–B), hyper-intense on T2-weighted imaging (C–D), and enhancing on T1-weighted FSE imaging after injection of MRI contrast (E–F). This was one of the larger lesions produced, with MRI-evident effects reaching down to the dorsal brain surface. Upper images, axial views; lower images, coronal views. Bar = 1 cm.