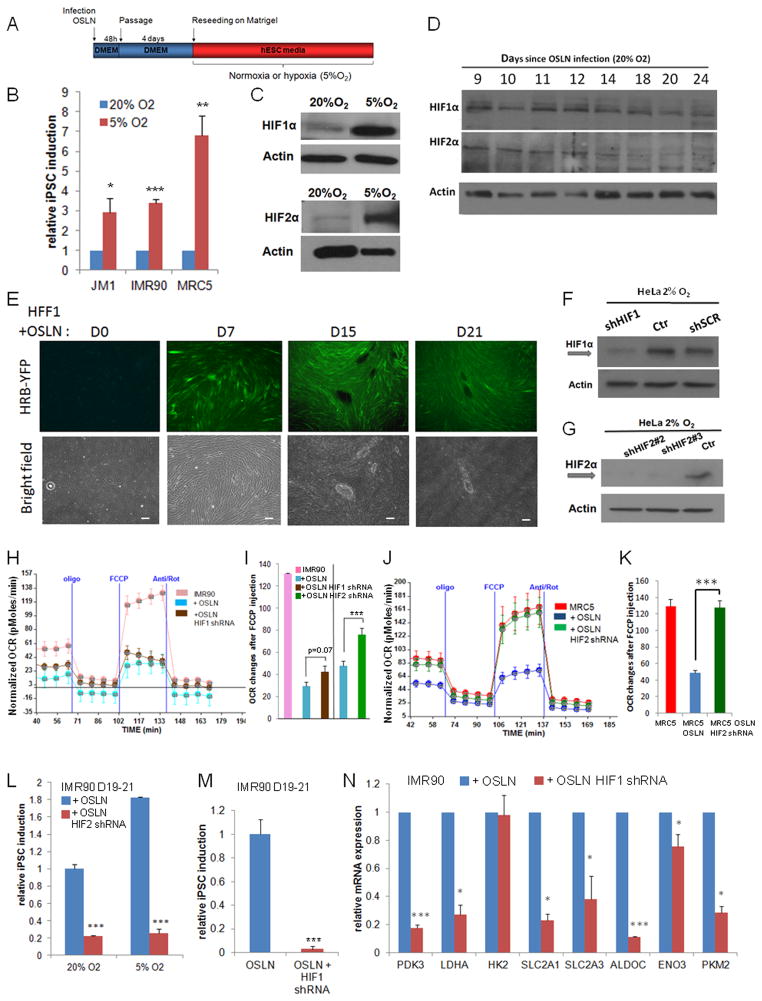
Figure 2.
HIFs are required for the metabolic switch in early reprogramming. (A–B) Hypoxia (5%O2) enhances iPSC formation in three cell lines, JM1, IMR90 and MRC5. Colonies were counted at day 21 after OSLN infection. (C) Comparison of HIF1α and HIF2α protein levels in the reprogramming cells under normoxia (20% O2, at day 9) and under hypoxia (5% O2, day 7). (D) HIF1α and HIF2α protein stabilization occurs in reprogramming fibroblasts (MRC5) under normoxia as shown by western blots. (E) HFF1 cells harboring a YFP hypoxia reporter show an increase of HIF activity during the course of reprogramming. Bars represent 200μm. Western blots validate the knock-down of HIF1α and HIF2α using shRNA against HIF1α (F) and HIF2α (G), respectively in HeLa cells. (H–I) The changes in oxidative metabolism are shown for IMR90, IMR90 infected with OSLN and IMR90 with OSLN+HIF1α shRNA or OSLN+HIF2α shRNA at day 8 of the reprogramming process, with a representative trace of OCR under mitochondrial stress protocol (H) and relative OCR changes after FCCP injection (I). (J–K) The changes in oxidative metabolism are shown for MRC5, MRC5 infected with OSLN and MRC5 with OSLN+HIF2α shRNA at day 8 of the reprogramming process, with a representative trace of OCR under mitochondrial stress protocol (J) and relative OCR changes after FCCP injection (K). OCR change in MRC5 with OSLN+HIF2α shRNA is significantly different from that in MRC5 infected with OSLN. (L) shRNA against HIF2α decreases iPSC colony formation in both 20% and 5% O2 as compared to the control. (M) shRNA against HIF1α reduces the number of colonies observed at day 19–21. (N) Expression of metabolic genes are reduced at day 23 in IMR90 with OSLN+HIF1α shRNA as compared to the control. P values were calculated using Student’s t-test. *, P< 0.05; **, P< 0.01 and ***, P<0.001. Bars show SEM for at least 3 separate experiments.
See also Figures S2 and S3.

