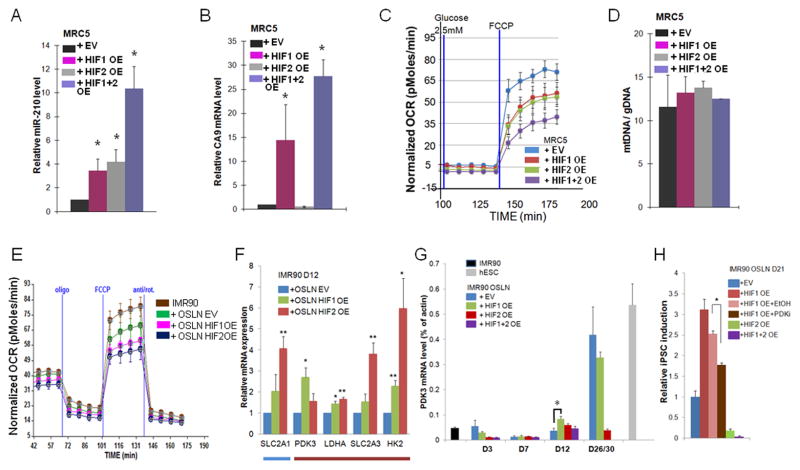
Figure 4.
HIF1α and HIF2α over-expression are sufficient to induce a metabolic change. (A–D) In MRC5 fibroblasts infected with HIF1α OE alone, HIF2α OE alone or HIF1α OE and HIF2α OE together, (A) Carbonic anhydrase 9 (CA9) expression was induced only in HIF1α over-expressing cells, and (B) miR-210 expression was induced both in HIF1α and HIF2α over-expressing cells, confirming the functionality of the over-expressed HIF proteins. (C) Both HIF1α and HIF2α over-expression in MRC5 fibroblasts without OSLN factors induced glycolytic metabolism similar to hESC H1. Shown are representative SeaHorse traces. (D) Mitochondrial DNA copy number was not changed in HIF1α or HIF2α over-expressing MRC5 fibroblasts. (E) Both HIF1α and HIF2α over-expression in reprogramming cells (IMR90+OSLN) at day 8 timepoint resulted in a further decrease in the OCR. (F) qPCR validation of the expression level of metabolic genes that were up-regulated by HIF1α or HIF2α OE in D12 sample compared to the control (blue and red bars indicate the comparative expression in control as illustrated in Fig 1D). (G) Kinetics of PDK3 mRNA level in IMR90 reprogramming cells is shown as the percentage of actin. (H) Treatment of PDK3 inhibitor (PDKi) on HIF1α OE cells reduces colony formation as compared to HIF1α OE cells in the vehicle control (EtOH). P values were calculated using Student’s t-test. *, P< 0.05, and **, P< 0.01. Bars show SEM for at least 3 separate experiments.
See also Figure S5.

