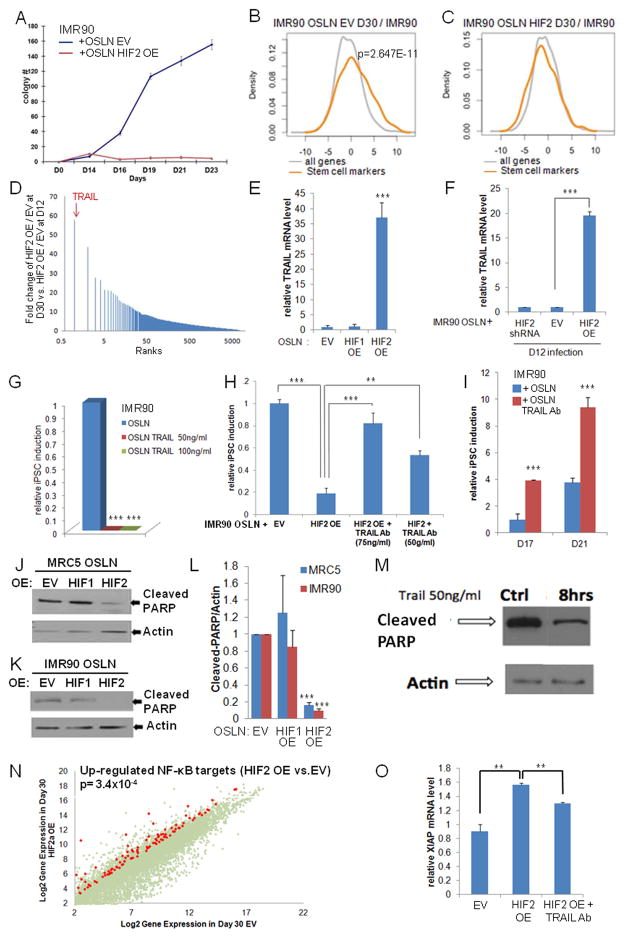
Figure 5.
HIF2α inhibits iPSC formation through TRAIL activation. (A) Kinetics of iPSC colony formation in HIF2α over-expressing (OE) IMR90 fibroblasts (OSLN+HIF2α), showing an increase in early (before Day 14) but dramatic reduction of iPSC colony formation in late time points compared to the control (OSLN+EV). (B) Stem cell markers are significantly up-regulated in the control, but not in (C) HIF2α OE cells during reprogramming. (D) Microarray analysis reveals that TRAIL is the most up-regulated gene at D30 in HIF2α OE reprogramming cells compared to normal IMR90 reprogramming cells. (E) qPCR validation shows the high TRAIL mRNA expression in HIF2α, but not in HIF1α, OE reprogramming cells in late timepoints (D30). (F) TRAIL mRNA expression increased at late timepoints (D30) in HIF2α OE cells infected at day 12 of the reprogramming process compared to OSLN control in cells. (G) Administration of TRAIL during IMR90 reprogramming process (from Day6/7) represses iPSC formation, but not fibroblast growth. (H) Administration of TRAIL antibody on HIF2α over-expressing cells rescues iPSC formation in IMR90. Colonies were counted at day 21. (I) Administration of TRAIL antibody (75ng/ml) in the normal reprogramming process (in IMR90) promotes colony formation. In both MRC5 (J) and IMR90 (K) reprogramming cells, HIF2α OE represses PARP cleavage 5 fold (L) as compared to empty vector control and HIF1α OE cells (three independent experiments). (M) Western blots confirm that PARP cleavage is reduced in reprogramming cells treated with 50ng/ml TRAIL for 8 hours as compared to the control. (N) NF-κB target genes are visualized on a scatter plot comparing HIF2α OE at day 30 to EV for those that are 4 fold higher expressed in HIF2α OE cells. (O) Quantification of XIAP expression by real-time RT-PCR assay shows an increased XIAP expression in HIF2α OE reprogramming cells as compared to the EV at day 27. Importantly, such an increase is reduced in HIF2α OE reprogramming cells treated with TRAIL neutralizing antibody. P values were calculated using Student’s t-test. **, P< 0.01 and ***, P<0.001. Bars show SEM for at least 3 separate experiments.
See also Figure S6.

