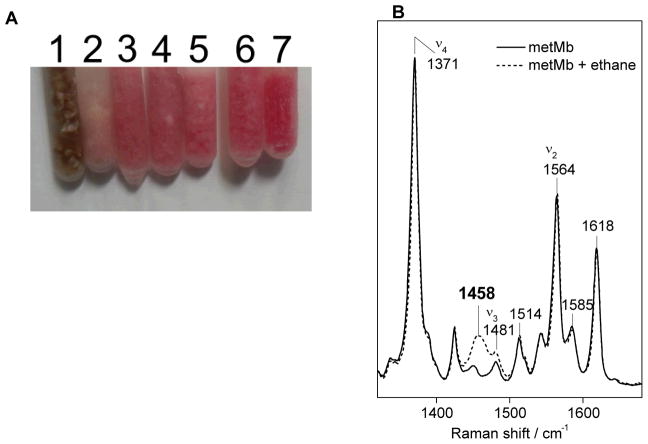
Figure 4.
Visual comparison of frozen samples of metMb (1) and the metMb(NO) adduct (7) and the RFQ samples obtained at 6 ms (2), 12 ms (3), 20 ms (4), 75 ms (5), and 280 ms (6) (A). Low-temperature RR spectra of RFQ-metMb control before and after evaporation of liquid ethane (B) (λexc = 406 nm, 5 mW; monochromator settings: 100 um slit, 0.67 m focal length, 2400 groove/mm grating; sample temperature, 110 K).

