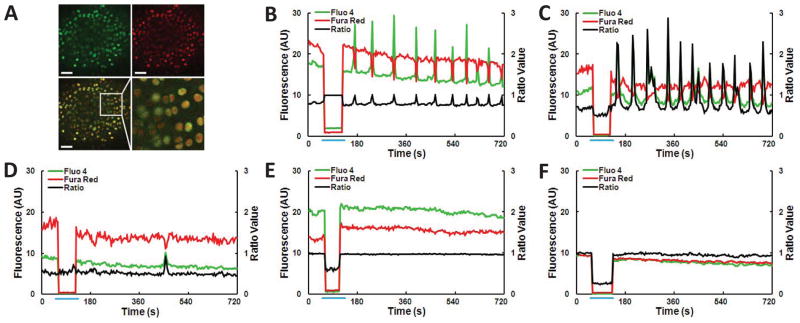
Fig. 2.

(A) Typical confocal image of an ex vivo wild type murine femora after incubation with calcium sensitive dyes; Fluo-4 (green), Fura Red (red), overlay of green and red fluorescence, magnified section of the boxed area of the overlay, depicting image resolution obtained during [Ca2+]i experiments. Scale bars are 50 μm. (B–F) Characteristic wild type chondrocyte [Ca2+]i ratio data of individual cells from the following treatments: (B, C) Multiple [Ca2+]i transients after (B) 1 ng/mL IL-1 treatment or (C) 5 ng/mL TGF-β; (D) Single [Ca2+]i transient after 5 ng/mL TGF-β; absence of [Ca2+]i transients from (E) 1 ng/mL IL-1 vehicle control or (F) 5 ng/mL TGF-β vehicle control. Fluorescence measured in arbitrary units (AU). Blue line indicates time of withdrawal and infusion of media from the chamber resulting in changes to fluorescence due to shifting focal plane.
