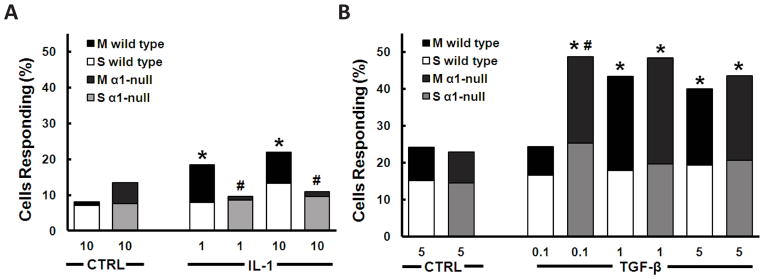
Fig. 3.

Representation of the percentage of chondrocytes responding with multiple (M) or single (S) [Ca2+]i transients as a function of stimulant IL-1 (A), TGF-β (B), or vehicular control (CTRL)), concentration (ng/mL), and genotype (wild type or integrin α1-null (α1-null)). Note that integrin α1-null chondrocytes are insensitive to IL-1 but hypersensitive to TGF-β, and that the additional responses with treatment are largely multiple [Ca2+]i transients. ‘*’ indicates significantly different from corresponding vehicular control (some data not shown) (wild type 1.0 ng/mL IL-1 P=0.0004, wild type 1.0 ng/mL TGF-β P=0.0003, wild type 5.0 ng/mL TGF-β P=0.0017). ‘#’ indicates significantly different from corresponding wild type stimulus (integrin α1-null 1.0 ng/mL P=0.0090, integrin α1-null 10.0 ng/mL IL-1 P=0.0011) respectively. P<0.0001 unless otherwise indicated. N=3 independent femora, n≥127 cells were used in each treatment.
