Fig. 4.
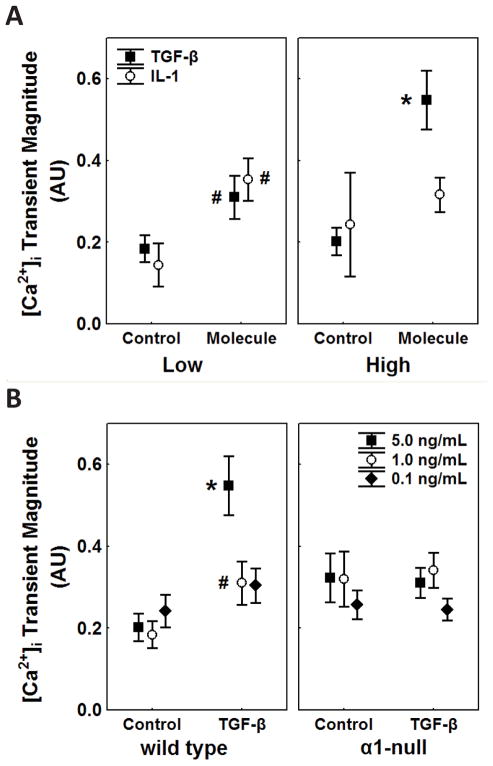
(A) [Ca2+]i transient magnitude of wild type chondrocytes as a function of concentration (low or high concentration that elicited a response) or treatment (vehicle (Control) or Molecule (IL-1 or TGF-β)), measured as the change in Fluo-4/Fura Red fluorescence ratio above baseline in arbitrary units (AU). Only chondrocytes that experienced [Ca2+]i transients were included in the peak analysis from the aforementioned treatments. Note the increase in magnitude in molecule compared to control transients in both TGF-β and IL-1 stimulated cells, and the greater increase of transient magnitude at the higher concentration of TGF-β but not IL-1. (B) [Ca2+]i transient magnitude as a function of genotype (wild type or integrin α1-null (‘α1-null’)) in either TGF-β or corresponding vehicular control treatments. In wild type chondrocytes, transient magnitude was larger in all concentrations when compared to corresponding vehicular controls, in contrast to integrin α1-null chondrocytes, where no increase of magnitude was observed. ‘*’ indicates point is significantly different than all other points on the same graph (P<0.0001), ‘#’ indicates point is significantly different than corresponding vehicular control (Low TGF-β concentration P=0.0118, Low IL-1 concentration P=0.0213, 1.0 ng/mL TGF-β P=0.0082). N=3 independent femora and n≥144 cells for each mean; error bars indicate 95% confidence intervals.

