
Fig. 5.
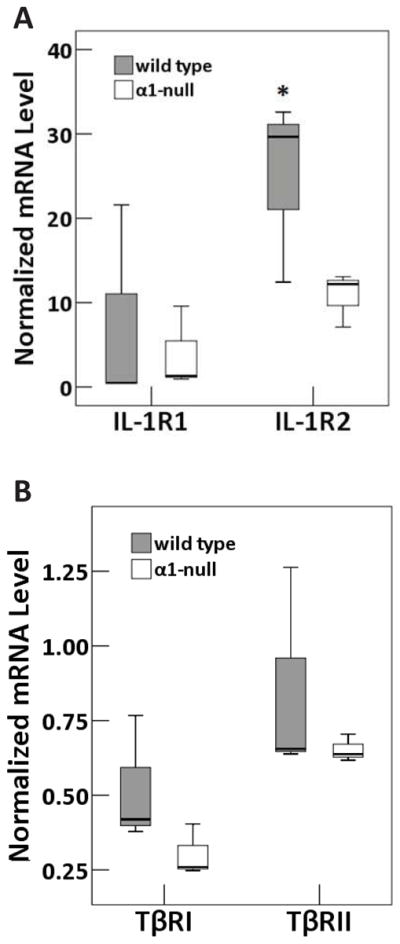
Box and whisker plots representing normalized mRNA levels of (A) IL-1R1 and IL-1R2 and (B) TβRI and TβRII from wild type or integrin α1-null mice. Absolute values of mRNA were calculated for each gene of interest and normalized to GAPDH housekeeping gene. ‘*’ indicates significantly different from corresponding integrin α1-null value (P<0.01). Triplicates of three independent mRNA samples were evaluated in each group. Each independent mRNA sample was extracted from pooled cartilage samples harvested from 8 mice.