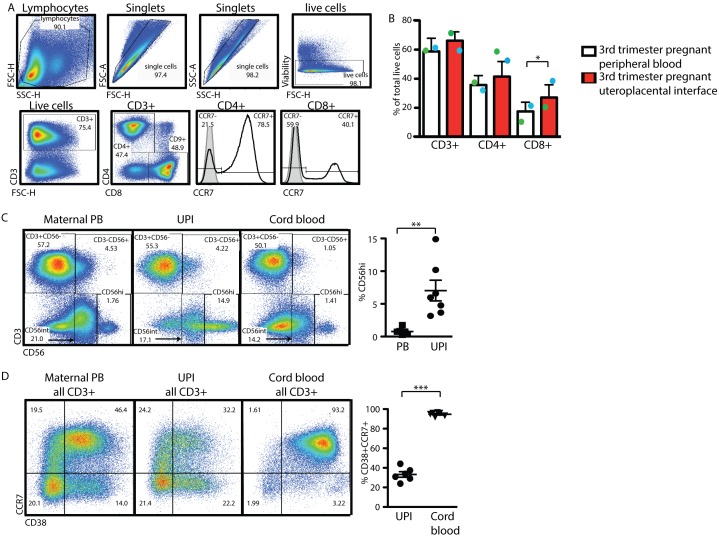
Figure 5. The uteroplacental interface displays a unique composition of lymphocytes.
Positive populations of CCR7 are determined with the help of isotype staining (full grey histogram) or antibody staining (black line) on total CD4 or CD8 populations. (A) Lymphocytes of the UPI were analyzed in parallel with peripheral blood of the same subject, gates were set based on the populations in peripheral blood of the same subject. (B) Percentage of the live cells identified as CD3+, CD3+CD4+ or CD3+CD8+ in peripheral blood and UPI. (C) Identification of lymphocyte sub-populations in total live cells in maternal PB (left dot blot), UPI (middle dot blot) and matched cord blood (right dot blot). Percentage of CD3–CD56hi cells in maternal PB and UPI (graph right hand) off total live lymphocytes. (D) Identification of CCR7+CD38+ T lymphocytes in total CD3+ cells in maternal PB (left dot blot), UPI (middle dot blot) and matched cord blood (right dot blot). Percentage of CCR7+CD38+ cells in maternal UPI and cord blood (graph right hand) off total CD3+ lymphocytes. Statistical analysis was done using a non-paired two-tailed Student’s T test (*,**,***p<0.05).

