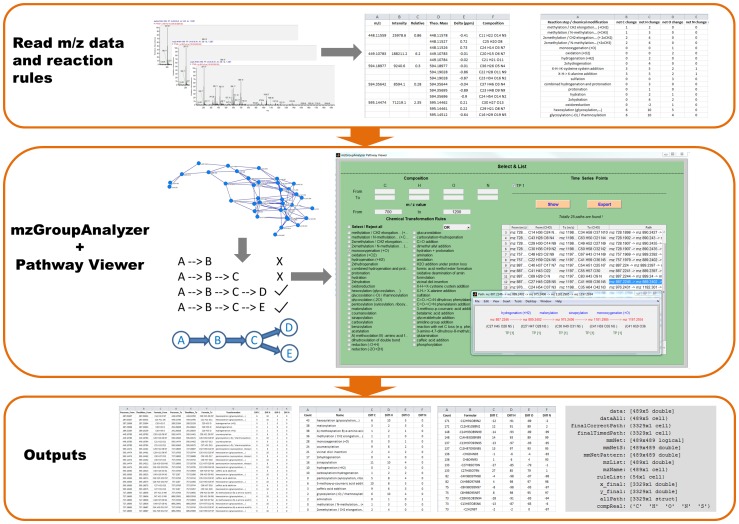
Figure 1. Scheme of the mzGroupAnalyzer and Pathway Viewer algorithm and GUI implementation.
The program reads the m/z features which are extracted from Xcalibur, as well as the user predefined reaction rules. Then it finds transformations between all pairs of m/z features, and reports the frequency of transformations for the listed and not listed but potentially existing rules. Next, the program starts searching pathways inside the m/z features' network. A shorter path existing in other longer paths is removed, thereby non-redundant pathways are obtained. Then, mzGroupAnalyzer opens the Pathway Viewer, in which pathways satisfying user-defined filtering options will be displayed on the panel. The pathway diagram, which consists of reaction rules, m/z feature names, compositions and time points, can be plotted by clicking the table. Finally, all the results, including the frequency table of transformations, the interconnected network visualization file (in Pajek's format), the inferred pathways and a Matlab workspace (suffixed with mzStruct.mat) containing all results, will be exported to the user-specified folder.

