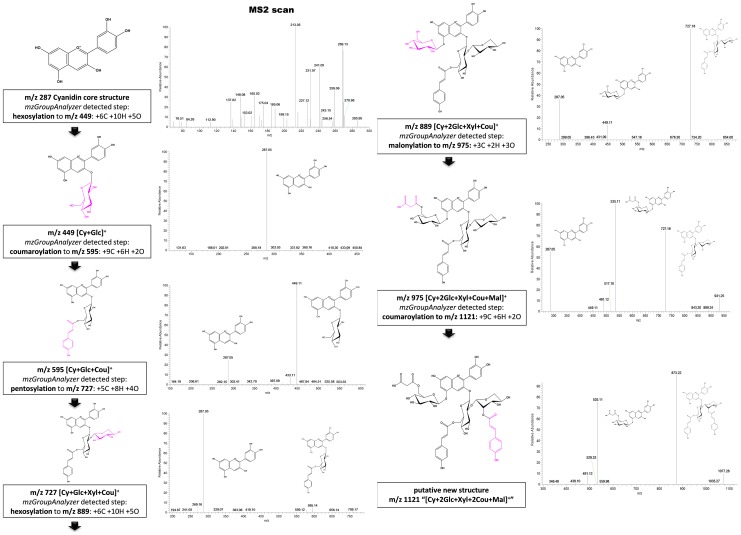
Figure 5. Identification of biochemical transformations of in vivo data using mzGroupAnalyzer.
A metabolic pathway leading to a putative new compound m/z 1121 is revealed. Amongst several hundreds of other interlinked m/z values in the data, the figure shows metabolic transitions derived from sub-ppm accuracy measurements on the left side and their corresponding MS2 product ion scans on the right. Comparison of the spectral information from step to step reveals the possible location of metabolic structural changes. Stereochemistry is assumed due to literature findings [33].

