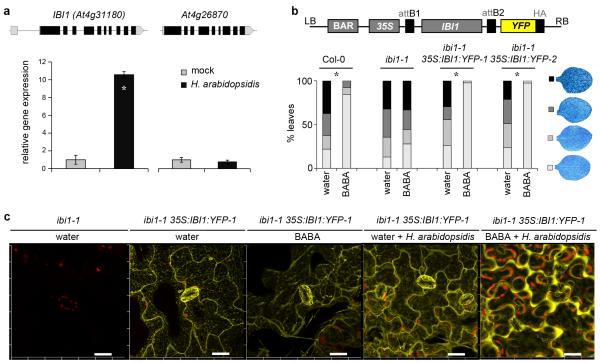
Figure 2. Characterization of the defence function of IBI1.
(a) Transcript accumulation of IBI1 and its close homologue At4g26870 in Col-0 at 5 dpi with H. arabidopsidis WACO9. Data represent average gene expression values (± SEM), relative to mock-inoculated plants. Asterisks indicates a statistically significant difference between treatments (Student’s t-test, p<0.05, n=3). (b) Transformation of ibi1-1 with 35S:IBI1:YFP restores induced resistance against H. arabidopsidis WACO9 after root treatment with BABA (150 μM). Insets show different classes of pathogen colonization; asterisks indicate statistically significant differences in class distribution relative to water-treated plants (Fisher’s exact test, p<0.01, n=50-100). (c) Confocal laser-scanning microscopy analysis of subcellular IBI1:YFP in 35S:IBI1:YFP-1 plants at 2 days after root treatment with water or BABA (150 μM), and 5 days after subsequent H. arabidopsidis WACO9 inoculation. Yellow indicates fluorescence by IBI1:YFP; red indicates chlorophyll fluorescence from chloroplasts. Left panel shows lack of YFP fluorescence in un-transformed ibi1-1 plants. Scale bar = 20 μm.

