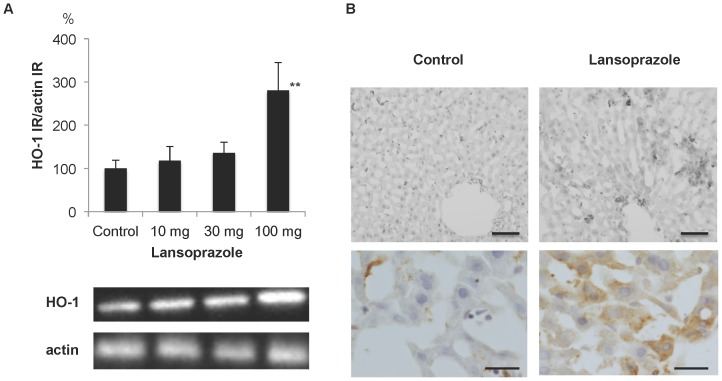
Figure 3. Up-regulation of HO-1 IR in hepatocytes following single oral treatment with lansoprazole.
A) Up-regulation of HO-1 IR in the liver at 6 h. ** P<0.01 compared with control. Representative photographs showing an increase of HO-1 IR. B) Immunohistochemistry for HO-1 in the liver at 6 h. Signals for HO-1 IR were detected in macrophages in the control. De novo signals for HO-1 IR were observed in hepatocytes in response to treatment with lansoprazole. Upper panel bar = 100 µm. Lower panel bar = 20 µm.

