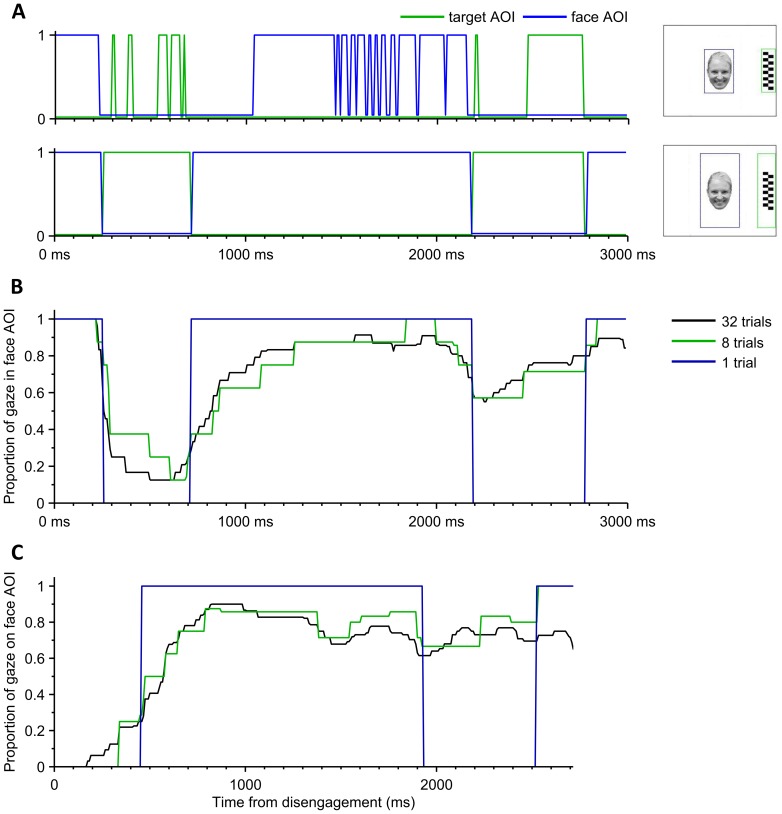
Figure 2. Nature of the eye tracking data.
A) These two graphs demonstrate how widening AOIs (shown in the right hand side) affect the binary time series computed from the same eye tracking data of one single trial. using Widening the additional horizontal margins of face AOI from 0° (top graph) to 3.4° (120 pixels; bottom graph) removes the spiky appearance in the face and target AOIs (blue and green, respectively). This we consider as “measurement noise” due to many uncontrollable factors, and we reason that the dynamically more stable AOI time series with wider AOI margins would better reflect the cognitive phenomena of our interest. For instance, infant’s gaze is first directed to the face, but switches to peripheral target for a period between 250 and 700 ms translating into the disengagement time (DT) of 250 ms. If narrower margins were applied (top), a slightly delayed DT would be measured, and the dynamics of the last 2000 ms in trial would be highly distorted. B) A representative example of a dynamic average responses of one participant with different number of trials taken into the averaging (1, 8, and 32). The response resolution (step size) in vertical axis is always inversely proportional to the number of trials included in the averaging. C) An example of disengagement time-locked dynamic responses. Prior to averaging, each trial time series is shifted in time according to the moment when gaze first reached the target AOI (DT time-locking) and the data before that is omitted. This approach offers better representation of gaze changes where DT may be variable across trials. Note that the data presented here is from the same experiment as in figures A and B.

