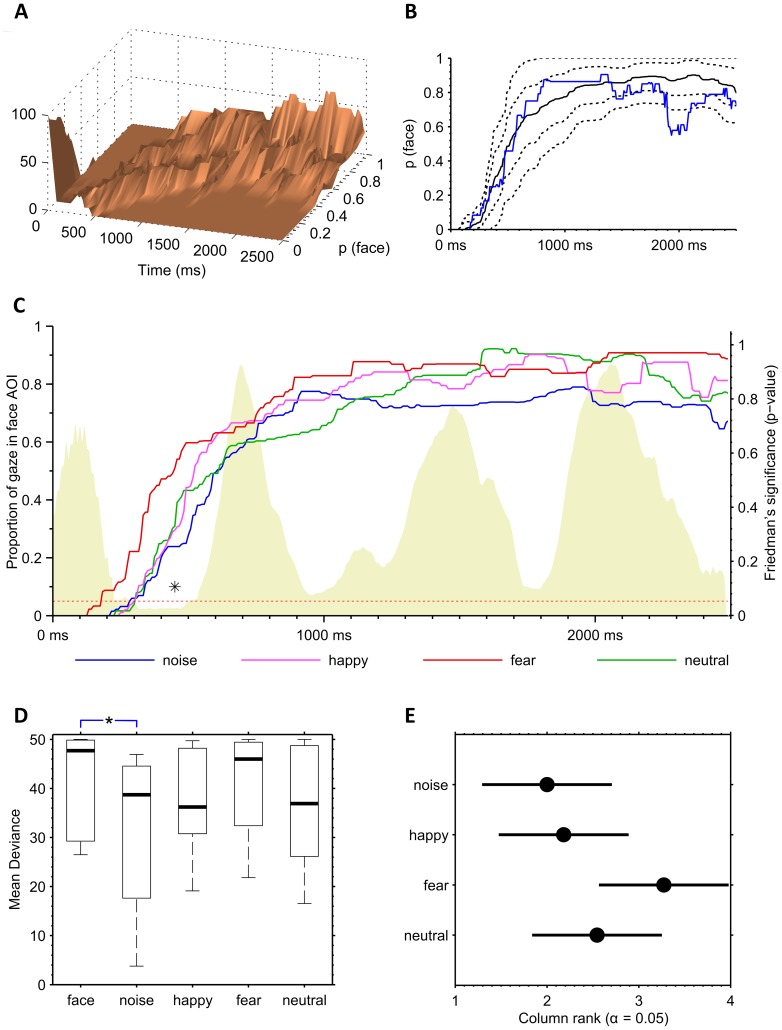
Figure 3. Statistical characteristics of the eye tracking data.
A–B) Properties of the DT time-locked face AOI dynamic response (DR). The summary graph of DR average responses over all individuals (A) reveals clear changes of distribution within the trial time. These distributions were used in the graph B where we computed bootstrapped estimates (5000 samples) of the grand median DR (black solid line) as well as the 10th, 25th, 75th, and 90th percentile ranges (black stippled lines). The percentiles used in computation of the mean deviance (MD metric) of an individual DR trace (blue) were however from the original DR data of the control group, not from the bootstrapped distribution. C) DT time-locked average dynamic responses (DR) for each stimulus condition. The non-face stimulus (blue) yielded generally lower DR values, and the DR trace after fearful face (red) was generally higher. There were only marginal differences if the traces were compared for each time point. The smoothed time-series of p-values of non-parametric Friedman’s tests (shaded area, right side vertical axis) computed for each time point (8-ms time frame) reveals one local minimum that yields p-values under 0.05.This occurs between 350 and 500 ms from the disengagement which is a typical time frame for the gaze to return from the distractor. D) Comparison of stimulus-specific Mean Deviances (MD) derived from the individual DR. There was a significantly lower MD with non-face stimulus (noise) compared to combined face condition (p = 0.05; Mann-Whitney U test). MDs were computed from the 13 infants of the Helsinki control group and are presented in the boxplot graphs on the left. E) Post-hoc analysis (Tukey’s test) comparing MDs of the stimulus conditions. Each condition is represented by the group mean rank (circle) and the associated confidence interval. No significant differences are found. Lack of significant differences between facial expressions was probably due to the limited numbers of i) subjects in comparison and ii) trials inside MDs (max 8).

