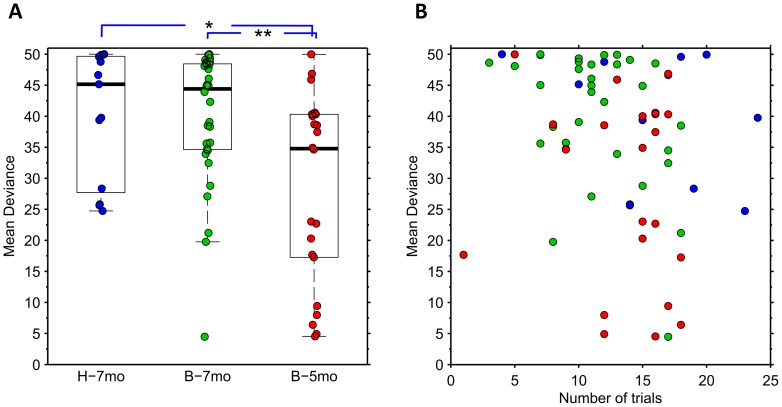
Figure 4. Individual and group level findings of the MD scores.
A) Summary of MD findings in all three infant groups: 7-month-old Helsinki (H-7mo) and Boston infants (B-7mo), and 5-month-old Boston infants (B-5mo). Scores of individual infants’ are illustrated with coloured circles with the underlying boxplot depicting the median and IQR, and the whiskers showing the total score extent neglecting the outliers (max length 1.5*IQR from the box edge).Comparison of MD scores between younger and older infants revealed age-related differences (** and * indicate p-values under 0.02 and 0.01 respectively; Mann–Whitney U test). B) Comparison of MD score and the number of trials available from each infant shows no systematic change in MD with an increase in trial numbers. The colour coding of circles depicts individual scores as shown in figure A.

