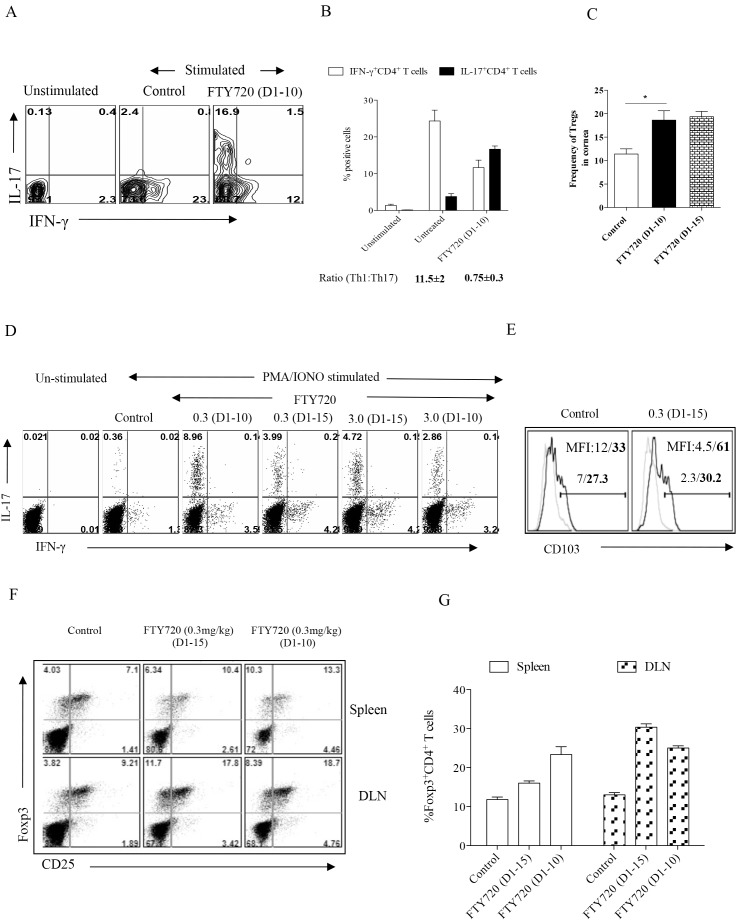
Figure 2. Continued therapy with FTY720 reduces proinflammatory cell infiltration while discontinued treatment leads to rapid influx of such cells.
C57BL/6 mice infected with HSV-1 were treated with various concentrations of FTY720 or vehicle 24 h pi. Few groups of mice received FTY720 till day 15 pi and in few groups FTY720 treatment was discontinued by day 10 pi. HSV-1 infected corneas harvested on day 15 pi, were processed and stained for different cell surface and intracellular molecules. (A) FACS profiles showing the frequencies of CD4+ T cells isolated from cornea of FTY720 treated and control groups of mice that produce IFN-γ or IL-17 upon PMA/Ionomycin stimulation. (B) Bar graph represents the percentage of CD4+ T cells isolated from cornea that produce IFN-γ or IL-17 in various groups of mice. (C) Bar graph represents the frequencies of CD4+ Foxp3+ regulatory T cells present in corneas isolated from various groups. Data represents means ± SEM of at least two independent experiments. Statistical significance was calculated by one-way ANOVA with Tukey’s multiple comparison tests. (*p≤0.05). (D) FACS plots showing the frequencies of CD4+ T cells isolated from draining lymph nodes that produce IFN-γ and IL-17 upon stimulating with PMA/Ionomycin. (E) FACS plots showing CD103 expression on IFN-γ+ cells (thin lines) and IL-17+ cells (thick lines). Numbers in histograms represent % positive cell of IFN-γ+ cells (normal letter) and IL-17+ CD4+ cells (bold letter). Experiments were repeated 3 times with 5 to 6 mice per group. (F) FACS plots showing the frequencies of CD4+CD25+Foxp3+ T cells in the lymphoid organs (Upper panel-spleen, Lower panel-DLN) of mice treated with FTY720 (0.3 mg/Kg Body Wt) from day 1 until day 14 pi. and those that were discontinued from the therapy. (G) Bar graphs depict the percentage of CD4+CD25+Foxp3+ T cells isolated from lymphoid organs of FTY720 treated and control groups.

