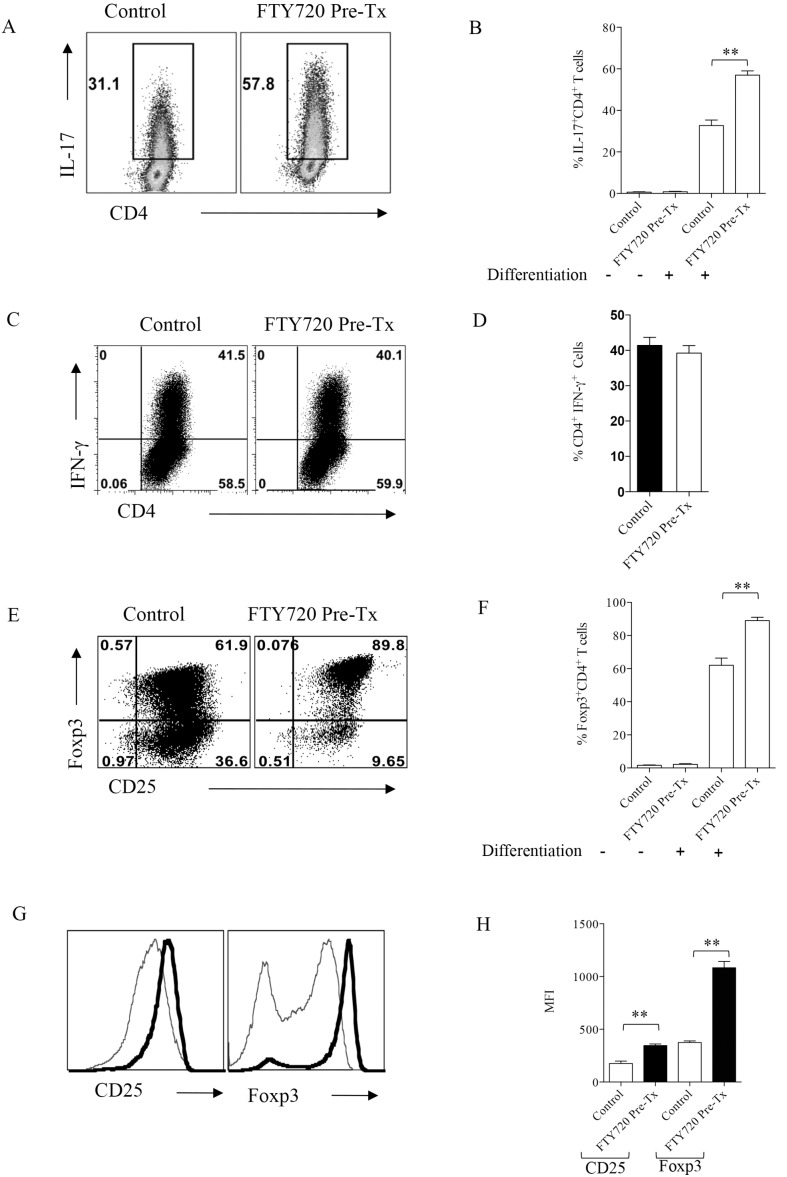
Figure 5. FTY720 ligation to S1P receptors promotes Tregs and Th17 cell differentiation.
DO11.10 Rag2−/− mice were treated with 0.3 mg/kg body wt of FTY720 for 7 days. Splenocytes were isolated either from FTY720 treated or control animals and their TCR was stimulated under Th1, Th17 or regulatory T cell polarizing conditions in vitro for 5 days. After 5 days of incubation, cells were stained for measuring the production of cytokines and transcription factor Foxp3 by intra cellular/nuclear staining. (A) FACS plots showing the frequencies of IL-17 producing Th17 cells in FTY720 pre-treated and control groups. (B) Bar graphs for the cumulative data on the frequencies of Th17 cells in two groups. (C) Representative FACS plots showing the frequencies of IFN-γ producing Th1 cells in FTY720 pre -treated and control groups. (D) Bar graphs depict the cumulative data of IFN-γ producing cells from different replicates. (E) FACS plots depicting the frequencies of CD25 and transcription factor, Foxp3 staining in differentiated regulatory T cells in FTY720 pre-treated and control groups. (F) Bar graphs represent the cumulative frequencies of Foxp3+ cells in different groups. (G) Histograms show the MFI of CD25 and Foxp3 expression in polarized Tregs in control (faint lines) and FTY720 pre treated (thick lines) groups (H) Bar graphs show the cumulative data of the MFI for CD25 and Foxp3 in control and FTY720 pre-treated group. Data represent means ± SEMs of at least two independent experiments. Statistical significance was calculated by one-way ANOVA with *p≤0.05, **p≤0.01, and ***p≤0.001.

