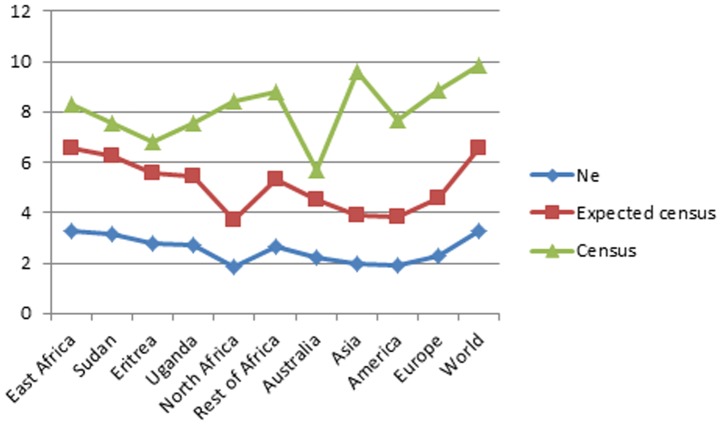
Figure 2. Line Plot. Line plot of the effective size (lower), expected census size (middle line) and actual census size (upper) of the continental populations and some east African populations.
Each point represents the log of actual values of the census, expected census and effective size of these populations. The expected census is obtained by calculating the current Ne by 10.

