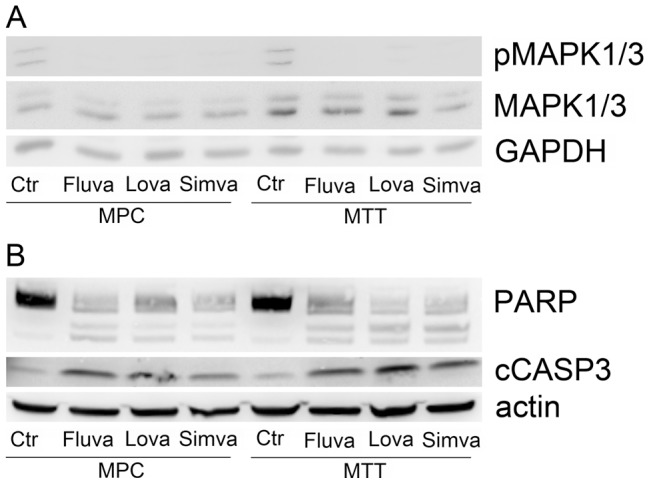
Figure 5. Expression of selected proteins in MPC and MTT after treatment with fluvastatin, simvastatin, or lovastatin.

A. Western blot showing decreased levels of pMAPK1/3 in treated vs. untreated MPC and MTT relative to total MAPK1/3 and GAPDH. B. Western blot showing decreased levels of intact PARP (top bands) and increased levels of cleaved PARP (lower bands) in treated vs. untreated MPC and MTT. In accordance, cleaved CASP-3 was elevated in treated cells, indicating apoptosis. Cells were treated with 25 µM of the indicated statin for 48 hours.
