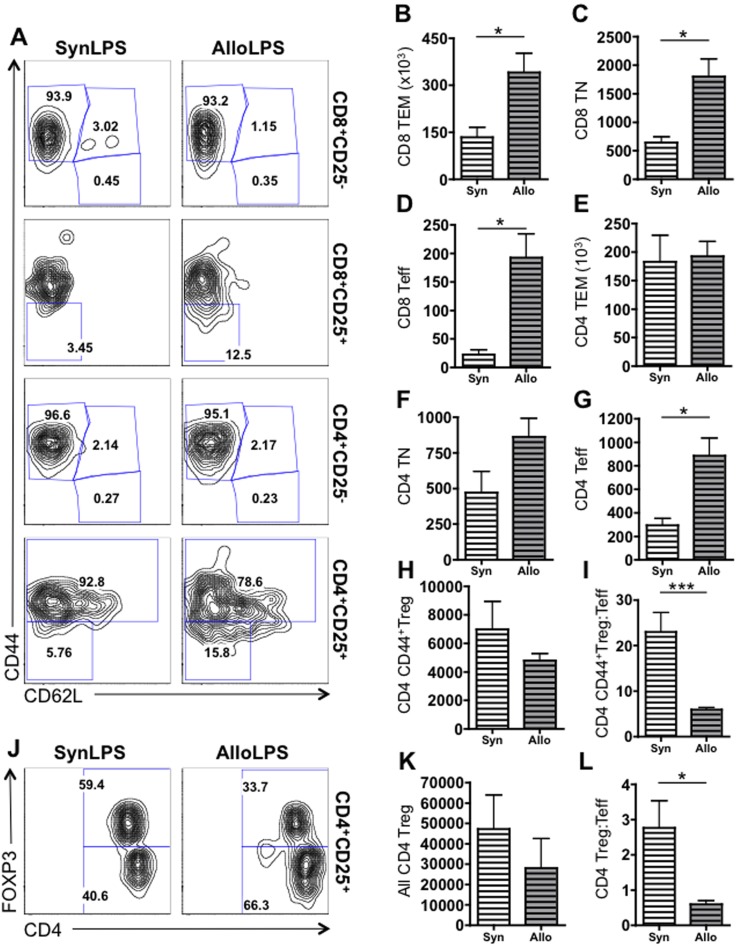
Figure 5. Allogeneic splenocyte transfer followed by inhaled LPS leads to preferential expansion of all CD8 T cell subsets and of effector CD4 T cells.
Rag1−/− mice received a transfer of allogeneic (Allo) or syngeneic (Syn) splenocytes followed by daily exposures to aerosolized LPS for 5 days starting 1 week after splenocyte transfer. Mice were euthanized 72 hours after the last LPS exposure and lung cells were analyzed using flow cytometry. CD8 and CD4 T cells were gated as described in figure 4 and then further subdivided into CD25+ and CD25− cells. (A) Representative flow cytometry plots for lungs cells from SynLPS (left column) and AlloLPS (right column) show expression of CD44 and CD62L. In the first row, CD8+CD25− cells are subdivided in CD44+CD62L− effector memory CD8 T cells (CD8 TEM), CD44+CD62L+ central memory CD8 T cells (CD8 TCM), and CD44−CD62L+ naïve CD8 T cells (CD8 TN). The majority of these CD25− CD8 T cells are TEM cells. In the second row, the subset of activated CD8 effector T cells (CD8 Teff), which are negative for CD44 and CD62L, is shown as a percentage of all activated CD8+CD25+ cells. The CD8 Teff percentage is higher in AlloLPS lungs as compared to the SynLPS lungs. In the third row, CD4+CD25− cells are subdivided in CD44+CD62L− effector memory CD4 T cells (CD4 TEM), CD44+CD62L+ central memory CD4 T cells (CD4 TCM), and CD44−CD62L+ naïve CD4 T cells (CD4 TN). The majority of these CD25− CD4 T cells are TEM cells. In the fourth row, the subset of activated CD4 effector T cells (CD4 Teff), which are negative for CD44 and CD62L, is shown as a percentage of all activated CD4+CD25+ cells. The CD4 Teff percentage is higher in AlloLPS lungs as compared to the SynLPS lungs. The CD44+ sub-population of CD4+CD25+ activated T cells have been previously identified as regulatory T cells (Treg). The percentage of these CD4 CD44+Treg is lower in AlloLPS compared to SynLPS. (B–I&K–L) Quantitative graphs are shown of absolute numbers of T cells in lungs of AlloLPS and SynLPS mice. (B–D) CD8 TEM (p = 0.038), CD8 TN (p = 0.025), and CD8 Teff (p = 0.015) cell numbers are all increased in AlloLPS lungs compared to SynLPS. (E–F) CD4 TEM and CD4 TN numbers are similar between AlloLPS and SynLPS lungs. (G) CD4 Teff cells are significantly increased in AlloLPS compared to SynLPS lungs (p = 0.019). (H) While CD4 CD44+Treg cell numbers are similar between AlloLPS and SynLPS, (I) the ratio of CD44+Treg to Teff is significantly lower in AlloLPS (p<0.0001). (J) Representative flow cytometry plots for CD4+CD25+ lungs cells from SynLPS (left) and AlloLPS (right) show expression of intracellular FOXP3 and CD4. The percentage of FOXP3+CD4+CD25 regulatory T cells (Treg) is lower, while the percentage of FOXP3−CD4+CD25+ effector T cells (Teff) is elevated, in AlloLPS compared to SynLPS. (K) While FOXP3+CD4+CD25+ Treg numbers are similar between AlloLPS and SynLPS, (L) the ratio of FOXP3+CD4+CD25+ Treg to FOXP3−CD4+CD25+ Teff is significantly lower in AlloLPS (p = 0.049). Numeric data represent the average +/− SEM and * = p<0.05 and *** = p<0.0005.

