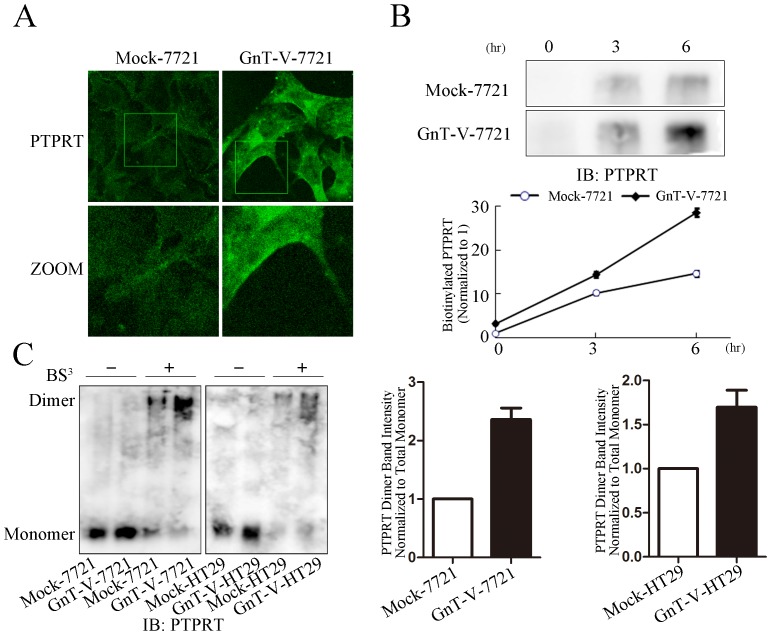
Figure 3. Increased β1,6 GlcNAc branching N-glycans on PTPRT prolongs PTPRT cell-surface retention time and promotes PTPRT's dimerization.
(A) Confocal microscopy was performed to observe the distribution of PTPRT in Mock-7721 and GnT-V-7721 cells. The mouse anti-human PTPRT and FITC-conjugated goat anti-mouse IgG were used. The bottom panel represents the magnified images of indicated area in the top panel. (B) Cell-surface retention of PTPRT was examined after cell-surface protein was biotinylated. The stable transfectants were re-cultured for 3 and 6 hours before they were homogenized and pulled down by streptavidin bounded agarose precipitation. After the precipitation, PTPRT was detected by immunoblot using anti-PTPRT antibody. The bottom chart is the quantification of band intensity in the upper panel. The band intensity of PTPRT at 3 or 6 hour time point was normalized to that at 0 hour in both Mock-7721 and GnT-V-7721. The data represent the mean ± SEM of three independent analyses. (C) Mock-7721, GnT-V-7721, Mock-HT29 and GnT-V-HT29 cells were grown to confluence in 6-well dishes and cross-linked with 3 mM BS3 at 4°C for 2 hours, followed by immunoblot for PTPRT. The graph (right panel) is the band intensity analysis of dimer band intensity normalized to its total monomer. The data represent the mean ± SEM of three independent analyses.

